Lunar Eclipse Figures
Fred Espenak, NASA's GSFC
Each lunar eclipse has two diagrams associated with it along with data pertinent to the eclipse. The top figure shows the path of the Moon through Earth's penumbral and umbral shadows. Above this figure are listed the instant of ecliptic conjunction of the Moon with the point 180° from the Sun (i.e., Full Moon) and the instant of greatest eclipse [1], expressed in Terrestrial Dynamical Time and Universal Time. The penumbral and umbral magnitudes are defined as the fraction of the Moon's diameter immersed in the two shadows at greatest eclipse. The radii of the penumbral and umbral shadows, P. Radius and U. Radius, are also listed. Gamma is the minimum distance in Earth radii of the Moon's center from Earth's shadow axis at greatest eclipse, and Axis is the same parameter expressed in degrees. The Saros series of the eclipse is listed, followed by a pair of numbers. The first number identifies the sequence position of the eclipse in the Saros; the second is the total number of eclipses in the series.
In the upper left and right corners are the geocentric coordinates of the Sun and the Moon, respectively, at the instant of greatest eclipse. They are:
R.A. - Right Ascension
Dec. - Declination
S.D. - Apparent Semi-Diameter
H.P. - Horizontal Parallax
To the lower left are the semi, or half, durations of the penumbral, umbral (partial), and total eclipses. Below them are the Sun/Moon ephemerides used in the predictions, followed by the extrapolated value of ΔT (the difference between Terrestrial Dynamical Time and Universal Time). To the lower right are the contact times of the Moon with Earth's penumbral and umbral shadows, defined as follows:
P1 - Instant of first exterior tangency of Moon with Penumbra. (Penumbral Eclipse Begins)
U1 - Instant of first exterior tangency of Moon with Umbra. (Partial Umbral Eclipse Begins)
U4 - Instant of last exterior tangency of Moon with Umbra (Partial Umbral Eclipse Ends)
P4 - Instant of last exterior tangency of Moon with Penumbra. (Penumbral Eclipse Ends)
The bottom figure is a cylindrical equidistant projection map of Earth that shows the regions of visibility for each stage of the eclipse. In particular, the moonrise/moonset terminator is plotted for each contact and is labeled accordingly. The point where the Moon is in the zenith at greatest eclipse is indicated by an asterisk. The region that is completely unshaded will observe the entire eclipse, while the darkly shaded area will witness no eclipse. The remaining lightly shaded areas will experience moonrise or moonset while the eclipse is in progress. The shaded zones east of the asterisk will witness moonset before the eclipse ends, and the shaded zones west will witness moonrise after the eclipse has begun.
The lunar eclipse figures are updates of versions originally published in Fifty Year Canon of Lunar Eclipses: 1986-2035 (Espenak, 1989).
The following key may be used to identify the features of the lunar eclipse figures from the "Thousand Year Canon of Lunar Eclipses 1501 to 2500".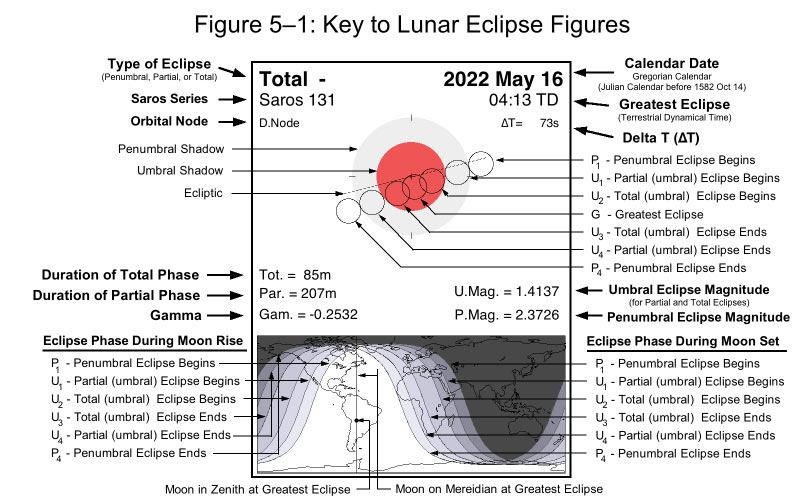
Footnotes
[1] The instant of greatest eclipse occurs when the distance between Earth's shadow axis and the center of the Moon reaches a minimum.
