|
|
|---|
![]()
Adapted from "Annular and Total Solar Eclipses of 2003" (NASA/TP-2002-211618).
![]()
Index to 2003 Annular Solar Eclipse
- 1.01 - Introduction
- 1.02 - Path of Annularity
- 1.03 - Orthographic Map of the May 31 Eclipse Path
- 1.04 - Stereographic Map of the May 31 Eclipse Path
- 1.05 - Detailed Maps of the Path of Annularity
- 1.06 - Elements, Shadow Contacts and May 31 Eclipse Tables
- 1.07 - Local Circumstances Tables for May 31
- 1.08 - Lunar Limb Profile for May 31
![]()
On Saturday, 2003 May 31, an annular eclipse of the Sun will be visible from a broad corridor that traverses the North Atlantic. The path of the Moon's antumbral shadow begins in northern Scotland, crosses Iceland and central Greenland, and ends at sunrise in Baffin Bay (Canada). A partial eclipse will be seen within the much broader path of the Moon's penumbral shadow, which includes most of Europe, the Middle East, central and northern Asia, and northwestern North America (Figures 1.1 and 1.2 ).
The trajectory of the Moon's shadow is quite unusual during this event. The shadow axis passes to the far north where it barely grazes Earth's surface. In fact, the northern edge of the antumbra actually misses Earth so that one path limit is defined by the day/night terminator rather than by the shadow's upper edge. As a result, the track of annularity has a peculiar "D" shape that is nearly 1200 kilometers wide. Since the eclipse occurs just three weeks prior to the northern summer solstice, Earth's northern axis is pointed sunwards by 22.8°. As seen from the Sun, the antumbral shadow actually passes between the North Pole and the terminator. As a consequence of this extraordinary geometry, the path of annularity runs from east to west rather than the more typical west to east.
The event transpires near the Moon's ascending node in Taurus five degrees north of Aldebaran. Since apogee occurs three days earlier (May 28 at 13 UT), the Moon's apparent diameter (29.6 arc-minutes) is still too small to completely cover the Sun (31.6 arc-minutes) resulting in an annular eclipse.
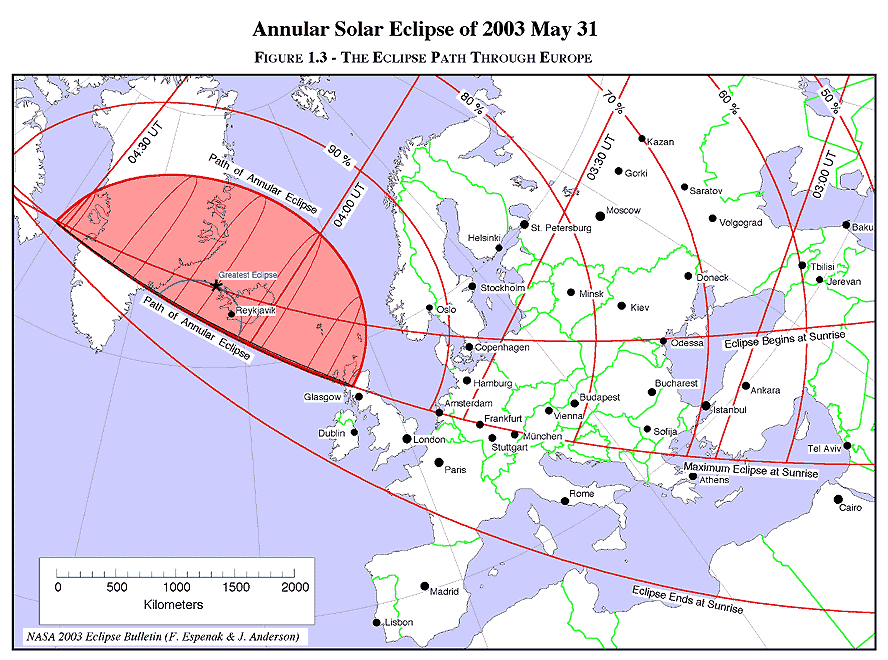
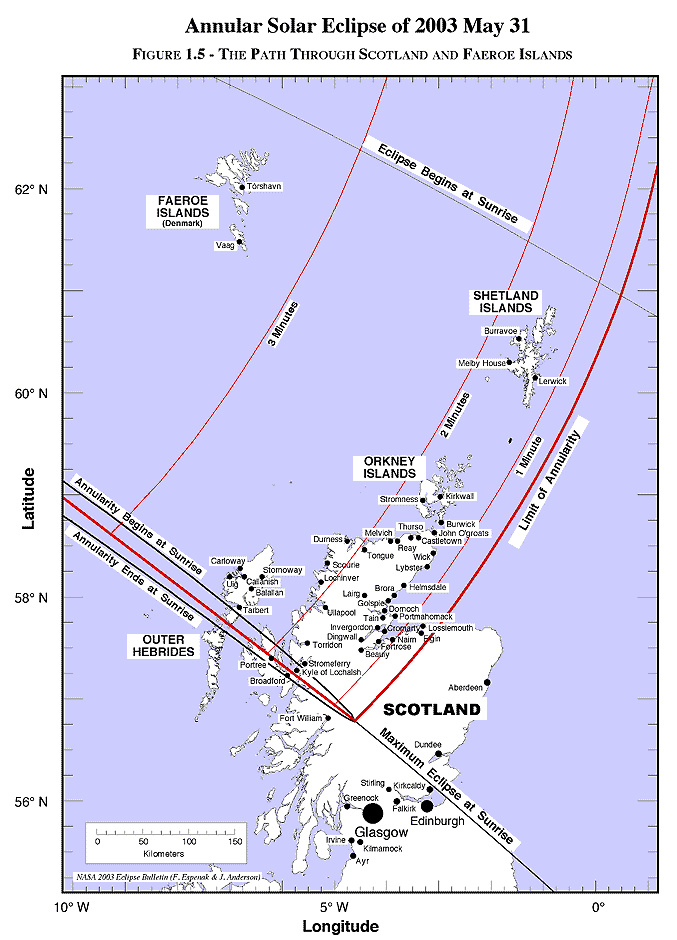
The annular eclipse begins in northern Scotland about 100 kilometers north of Glasgow when the Moon's antumbral shadow first touches down on Earth at 03:45 UT (Figures 1.3 and 1.4 ). The antumbra quickly extends northward as it travels on a northwestern trajectory. In Scotland, the Northwest Highlands, Loch Ness, the Isle of Lewis (Outer Hebrides), Orkney Islands and Shetland Islands all lie in the annular track where maximum eclipse occurs at or shortly after sunrise ( Figure 1.5 ). Several minutes later, the shadow's edge reaches the Faeroe Islands (03:51 UT) where annularity lasts 03 minutes 08 seconds with the Sun 4° above the northeastern horizon.
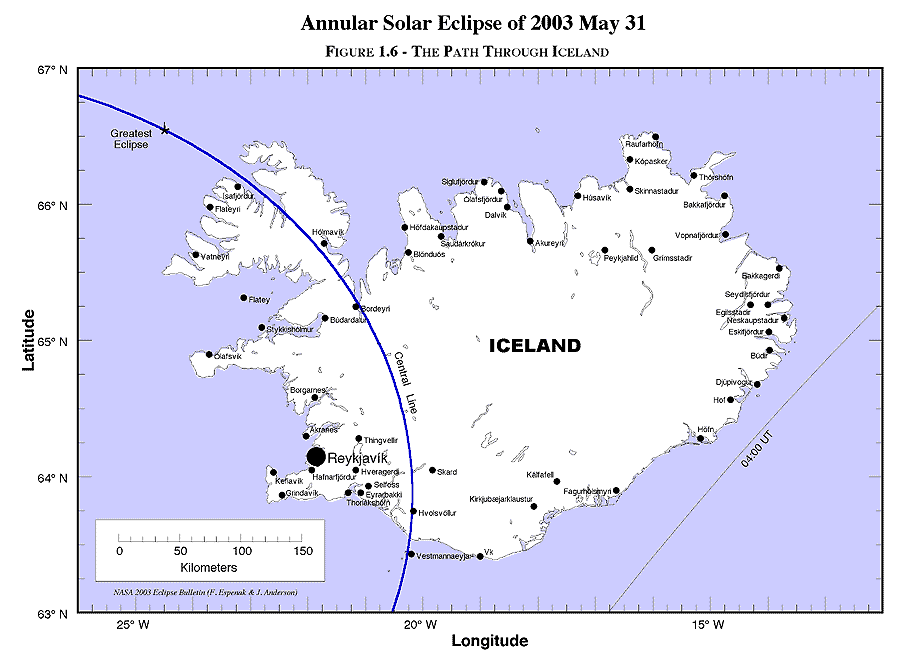
By 03:59 UT, the leading edge of the antumbra arrives along the southeastern coast of Iceland ( Figure 1.6 ). Traveling with a ground velocity of 2 kilometers per second, the shadow sweeps across the entire North Atlantic nation in ten minutes. The shadow is so broad that the duration of the three and a half minute annular phase varies by less than 5 seconds across all of Iceland. The capital city of Reykjavik lies in the southwest corner of the country. Here, the Sun will stand 2° high during the 3 minute 36 second annular phase. Unfortunately, the low altitude spectacle may be hidden from city dwellers by mountains lying to the northeast.
The instant of greatest eclipse1 occurs at 04:08:18 UT when the axis of the Moon's shadow passes closest to the center of Earth (gamma2 = +0.996). The length of annularity reaches its maximum duration of 3 minutes 37 seconds, the Sun's altitude is 3°, and the antumbra's velocity is 1.06 km/s. At that time, the shadow's axis is just 60 kilometers northwest of Iceland.
After traversing the Denmark Strait, the highly elliptical antumbra bisects Greenland where over a third of the enormous island lies within the track ( Figure 1.4 ). Crossing the ill-named land mass, the path width rapidly shrinks as the grazing antumbra begins its return to space. From Umanak, the Sun stands 3° above the Arctic horizon during the 2 minute 24 second annular phase. Seven hundred kilometers to the south, Godthåb (Nuuk) lies completely outside the path and will not even witness a partial eclipse.
As it departs Greenland and crosses Baffin Bay, the shadow leaves Earth's surface at 04:31 UT. From start to finish, the antumbra sweeps over its entire path in a little under 47 minutes.
1 The instant of greatest eclipse occurs when the distance between the Moon's shadow axis and Earth's geocenter reaches a minimum.
2 Minimum distance of the Moon's shadow axis from Earth's center in units of equatorial Earth radii.
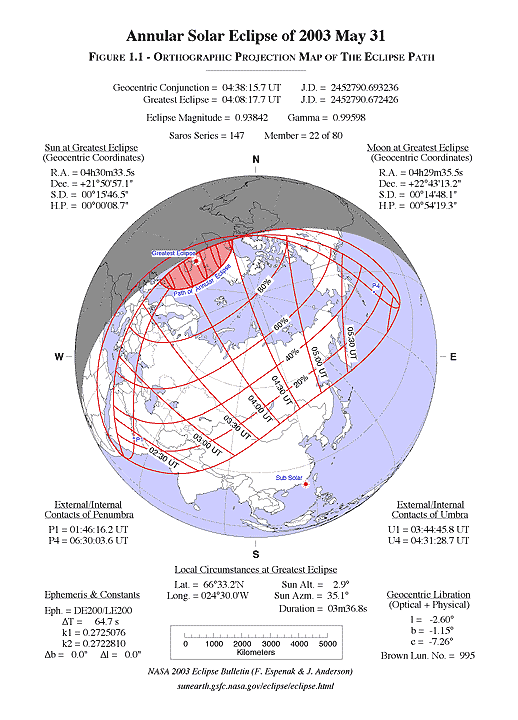
Figure 1.1 is an orthographic projection map of Earth [adapted from Espenak, 1987] showing the path of penumbral (partial) and antumbral (annular) eclipse. The daylight terminator is plotted for the instant of greatest eclipse with north at the top. The point of greatest eclipse is indicated with an asterisk-like symbol. The sub-solar point (Sun in zenith) at greatest eclipse is also shown.
The limits of the Moon's penumbral shadow define the region of visibility of the partial eclipse. This saddle shaped region often covers more than half of Earth's daylight hemisphere and consists of several distinct zones or limits. At the southern boundary lies the limit of the penumbra's path. Great loops at the western and eastern extremes of the penumbra's path identify the areas where the eclipse begins/ends at sunrise and sunset, respectively. Bisecting the 'eclipse begins/ends at sunrise and sunset' loops is the curve of maximum eclipse at sunrise (western loop) and sunset (eastern loop). The exterior tangency points P1 and P4 mark the coordinates where the penumbral shadow first contacts (partial eclipse begins) and last contacts (partial eclipse ends) Earth's surface. The path of the antumbral shadow travels east to west and is shaded dark gray.
A curve of maximum eclipse is the locus of all points where the eclipse is at maximum at a given time. They are plotted at each half hour Universal Time (UT), and generally run in a north-south direction. The outline of the antumbral shadow is plotted every ten minutes in UT. Curves of constant eclipse magnitude3 delineate the locus of all points where the magnitude at maximum eclipse is constant. These curves run exclusively between the curves of maximum eclipse at sunrise and sunset. Furthermore, they are quasi-parallel to the southern penumbral limit. This limit may be thought of as a curve of constant magnitude of 0%, while adjacent curves are for magnitudes of 20%, 40%, 60% and 80%.
At the top of Figure 1.1 , the Universal Time of geocentric conjunction between the Moon and Sun is given followed by the instant of greatest eclipse. The eclipse magnitude is given for greatest eclipse. For central eclipses (both total and annular), it is equivalent to the geocentric ratio of diameters of the Moon and Sun. Gamma is the minimum distance of the Moon's shadow axis from Earth's center in units of equatorial Earth radii. Finally, the Saros series number is given along with the eclipse's relative sequence in the series.
3 Eclipse magnitude is defined as the fraction of the Sun's diameter occulted by the Moon. It is strictly a ratio of diameters and should not be confused with eclipse obscuration, which is a measure of the Sun's surface area occulted by the Moon. Eclipse magnitude may be expressed as either a percentage or a decimal fraction (e.g.: 50% or 0.50).
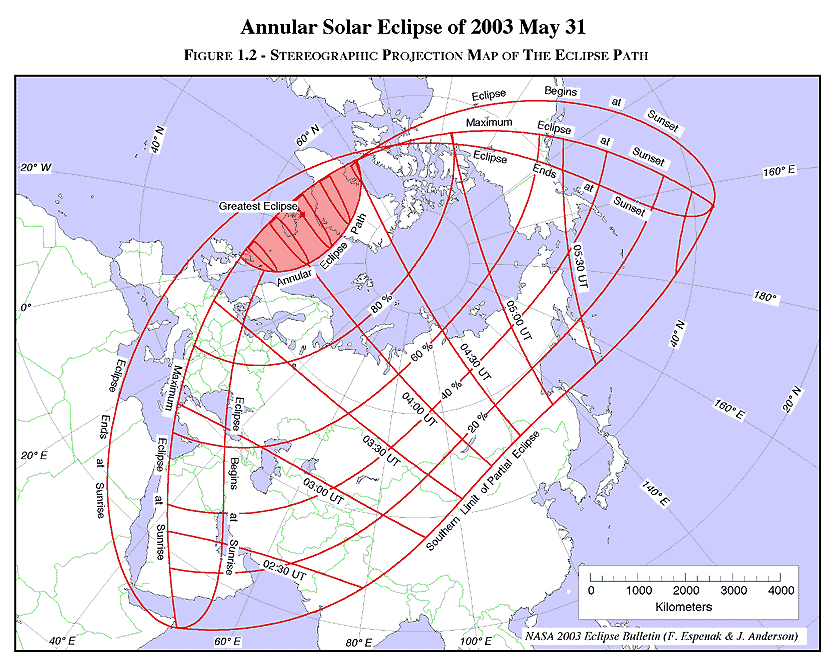
The stereographic projection of Earth in Figure 1.2 depicts the path of penumbral and antumbral eclipse in greater detail. The map is oriented with the north up. International political borders are shown and circles of latitude and longitude are plotted at 20° increments. The region of penumbral or partial eclipse is identified by its southern limit, curves of eclipse begins or ends at sunrise and sunset, and curves of maximum eclipse at sunrise and sunset. Curves of constant eclipse magnitude are plotted for 20%, 40%, 60% and 80%, as are the limits of the path of annular eclipse. Also included are curves of greatest eclipse at every half hour Universal Time.
Figures 1.1 and 1.2 may be used to quickly determine the approximate time and magnitude of maximum eclipse at any location within the eclipse path.
The path of annularity is plotted on a series detailed maps appearing in Figures 1.3 through 1.6. The maps were chosen to isolate small regions along path using coastline data from the World Data Bank II (WDBII). The WDBII outline files are digitized from navigational charts to a working scale of approximately 1:3 million.
The positions of larger cities and metropolitan areas are depicted as black dots. The size of each city is logarithmically proportional to its population using 1990 census data (Rand McNally, 1991). City data selected from a geographic data base of over 90,000 cities are plotted to give as many locations as possible in the path of annularity. Local circumstances have been calculated for many of these positions and can be found in Tables 1.6 through 1.15.
Although no corrections have been made for center of figure or lunar limb profile, they have little or no effect at this scale. Atmospheric refraction4 has not been included because it depends on the atmospheric temperature-pressure profile, which cannot be predicted in advance. These maps are also available on the web at http://eclipse.gsfc.nasa.gov/ASE2003/ASE2003.html.
4 The nominal value for atmospheric refraction at the horizon is 34 arc-minutes, but this value can vary by a factor or 2 depending on atmospheric conditions. For an eclipse in the horizon, the antumbral path is shifted in the direction opposite from the Sun.
The geocentric ephemeris for the Sun and Moon, various parameters, constants, and the Besselian elements (polynomial form) are given in Table 1.1. The eclipse elements and predictions were derived from the DE200 and LE200 ephemerides (solar and lunar, respectively) developed jointly by the Jet Propulsion Laboratory and the U. S. Naval Observatory for use in the Astronomical Almanac for 1984 and thereafter. Unless otherwise stated, all predictions are based on center of mass positions for the Moon and Sun with no corrections made for center of figure, lunar limb profile or atmospheric refraction. The predictions depart from normal IAU convention through the use of a smaller constant for the mean lunar radius k for all umbral contacts (see: 1.08 - Lunar Limb Profile for May 31). Times are expressed in either Terrestrial Dynamical Time (tdT) or in Universal Time (UT), where the best value of Delta T available at the time of preparation is used.
From the polynomial form of the Besselian elements, any element can be evaluated for any time t1 (in decimal hours) via the equation:
The polynomial Besselian elements were derived from a least-squares fit to elements rigorously calculated at five separate times over a six hour period centered at t0. Thus, the equation and elements are valid over the period 1.00 ≤ t1 ≤ 7.00 tdT.
Table 1.2 lists all external and internal contacts of penumbral and antumbral shadows with Earth. They include tdT times and geodetic coordinates with and without corrections for ΔT. The contacts are defined:
| P1 | Instant of first external tangency of penumbral shadow cone with
Earth's limb. (partial eclipse begins) |
| P4 | Instant of last external tangency of penumbral shadow cone with Earth's
limb. (partial eclipse ends) |
| U1 | Instant of first external tangency of antumbral shadow cone with Earth's
limb. (antumbral eclipse begins) |
| U2 | Instant of first internal tangency of antumbral shadow cone with Earth's limb. |
| U3 | Instant of last internal tangency of antumbral shadow cone with Earth's limb. |
| U4 | Instant of last external tangency of antumbral shadow cone with Earth's
limb. (antumbral eclipse ends) |
Similarly, the outhern extremes of the penumbral and antumbral paths, and extreme limits of the antumbral central line are given. The IAU (International Astronomical Union) longitude convention is used throughout this publication (i.e., for longitude, east is positive and west is negative; for latitude, north is positive and south is negative).
The path of the antumbral shadow is delineated at one minute intervals in Universal Time in Table 1.3. Coordinates of the terminator limit, the antumbral limit and the central line are listed to the nearest tenth of an arc-minute (~185 m at the Equator). The Sun's altitude, path width and antumbral duration are calculated for the central line position. Table 1.4 presents a physical ephemeris for the antumbral shadow at one minute intervals in UT. The central line coordinates are followed by the topocentric ratio of the apparent diameters of the Moon and Sun, the eclipse obscuration5, and the Sun's altitude and azimuth at that instant. The antumbral shadow's instantaneous velocity with respect to Earth's surface are included. Finally, the central line duration of the antumbral phase is given.
Local circumstances for each central line position listed in Table 1.4 are presented in Table 1.5. The first three columns give the Universal Time of maximum eclipse, the central line duration of annularity and the altitude of the Sun at that instant. The following columns list each of the four eclipse contact times followed by their related contact position angles and the corresponding altitude of the Sun. The four contacts identify significant stages in the progress of the eclipse. They are defined as follows:
| First Contact | Instant of first external tangency between the Moon and Sun.
(partial eclipse begins) |
| Second Contact | Instant of first internal tangency between the Moon and Sun.
(central or antumbral eclipse begins; annular eclipse begins) |
| Third Contact | Instant of last internal tangency between the Moon and Sun.
(central or antumbral eclipse ends; annular eclipse ends) |
| Fourth Contact | Instant of last external tangency between the Moon and Sun.
(partial eclipse ends) |
The position angles P and V identify the point along the Sun's disk where each contact occurs6. Second and third contact altitudes are omitted since they are always within 1° of the altitude at maximum eclipse.
5Eclipse obscuration is defined as the fraction of the Sun's surface area occulted by the Moon.
6 P is defined as the contact angle measured counter-clockwise from the north point of the Sun's disk.
V is defined as the contact angle measured counter-clockwise from the zenith point of the Sun's disk.
Local circumstances for ~330 cities and locations in the UK, Iceland, Europe and Asia are presented in Tables 1.6 through 1.15. These tables give the local circumstances at each contact and at maximum eclipse8 for every location. The coordinates are listed along with the location's elevation (meters) above sea-level, if known. Otherwise, the local circumstances are calculated for sea-level. The Universal Time of each contact is given to a tenth of a second, along with position angles P and V and the altitude of the Sun. The position angles identify the point along the Sun's disk where each contact occurs and are measured counter-clockwise (i.e., eastward) from the north and zenith points, respectively. Locations outside the antumbral path miss the annular eclipse and only witness first and fourth contacts. The Universal Time of maximum eclipse (either partial or annular) is listed. Next, the position angles P and V of the Moon's disk with respect to the Sun are given, followed by the altitude and azimuth of the Sun at maximum eclipse. Finally, the corresponding eclipse magnitude and obscuration9 are listed. For annular eclipses, the eclipse magnitude is identical to the topocentric ratio of the Moon's and Sun's apparent diameters.
Two additional columns are included if the location lies within the path of annularity The antumbral depth is a relative measure of a location's position with respect to the central line and path limits. It is a unitless parameter that is defined as:
where:
u| = | antumbral depth
| x | = | perpendicular distance from the shadow axis (kilometers)
| R | = | radius of the antumbral shadow as it
intersects Earth's surface (kilometers)
| |
The antumbral depth for a location varies from 0.0 to 1.0. A position at the path limits corresponds to a value of 0.0 while a position on the central line has a value of 1.0. The parameter can be used to quickly determine the corresponding central line duration. Thus, it is a useful tool for evaluating the trade-off in duration of a location's position relative to the central line. Using the location's duration and antumbral depth, the central line duration is calculated as:
where:
| D | = | duration of totality on the center line (seconds) |
| d | = | duration of totality at location (seconds) |
| u | = | antumbral depth |
The final column gives the duration of annularity. The effects of refraction have not been included in these calculations, nor have there been any corrections for center of figure or the lunar limb profile.
Locations were chosen based on general geographic distribution, population, and proximity to the path. The primary source for geographic coordinates is The New International Atlas (Rand McNally, 1991). Elevations for major cities were taken from Climates of the World (U. S. Dept. of Commerce, 1972). The city names and spellings presented here are for location purposes only and are not meant to be authoritative. They do not imply recognition of status of any location by the United States Government.
8 For partial eclipses, maximum eclipse is the instant when the greatest fraction of the Sun's diameter is occulted. For total eclipses, maximum eclipse is the instant of mid-totality.
9Eclipse magnitude is the fraction of the Sun's diameter occulted by the Moon, while eclipse obscuration is the fraction of the Sun's surface area occulted by the Moon.
Eclipse contact times, magnitude and duration of annularity all depend on the angular diameters and relative velocities of the Moon and Sun. These calculations are limited in accuracy by the departure of the Moon's limb from a perfectly circular figure. The Moon's surface exhibits a rather dramatic topography, which manifests itself as an irregular limb when seen in profile. Most eclipse calculations assume some mean radius that averages high mountain peaks and low valleys along the Moon's rugged limb. Such an approximation is acceptable for many applications, but if higher accuracy is needed, the Moon's actual limb profile must be considered. Fortunately, an extensive body of knowledge exists on this subject in the form of Watts' limb charts [Watts, 1963]. These data are the product of a photographic survey of the marginal zone of the Moon and give limb profile heights with respect to an adopted smooth reference surface (or datum). Analyses of lunar occultations of stars by Van Flandern [1970] and Morrison [1979] have shown that the average cross-section of Watts' datum is slightly elliptical rather than circular. Furthermore, the implicit center of the datum (i.e., the center of figure) is displaced from the Moon's center of mass. Additional work by Morrison and Appleby [1981] shows that the radius of the datum varies with libration producing systematic errors in Watts' original limb profile heights that attain 0.4 arc-seconds at some position angles. Thus, corrections to Watts' limb data are necessary to ensure that the reference datum is a sphere with its center at the center of mass.
The Watts charts have been digitized and may be used to generate limb profiles for any libration. Ellipticity and libration corrections can be applied to refer the profile to the Moon's center of mass. Such a profile can then be used to correct eclipse predictions which have been generated using a mean lunar limb.
The lunar limb profile in Figure 1.7 includes corrections for center of mass and ellipticity [Morrison and Appleby, 1981]. It is generated for the central line at 04:05 UT, corresponding to central Iceland. The Moon's topocentric libration (physical + optical) is l=-2.46° b=+1.28°, and the topocentric semi-diameters of the Sun and Moon are 945.5 and 888.2 arc-seconds, respectively. The Moon's angular velocity with respect to the Sun is 0.539 arc-seconds per second.
The radial scale of the limb profile (bottom of Figure 1.7) is greatly exaggerated so that the true limb's departure from the mean lunar limb is readily apparent. The mean limb with respect to the center of figure of Watts' original data is shown (dashed) along with the mean limb with respect to the center of mass (solid). Note that all the predictions presented in this publication are calculated with respect to the latter limb unless otherwise noted. Position angles of various lunar features can be read using the protractor marks along the Moon's mean limb (center of mass). The position angles of second and third contact are clearly marked along with the north pole of the Moon's axis of rotation and the observer's zenith at mid-annularity. The dashed line identifies the contact point on the north limb corresponding to the path limit. To the upper left of the profile are the Sun's topocentric coordinates at maximum eclipse. They include the right ascension R.A., declination Dec., semi-diameter S.D. and horizontal parallax H.P. The corresponding topocentric coordinates for the Moon are to the upper right. Below and left of the profile are the geographic coordinates of the central line at 04:05 UT while the times of the eclipse contacts at that location appear to the lower right. Directly below the profile are the local circumstances at maximum eclipse. They include the Sun's altitude, azimuth, and central duration of annularity. The position angle of the path's southern limit axis is PA(N.Limit) and the angular velocity of the Moon with respect to the Sun is A.Vel.(M:S). At the bottom left are a number of parameters used in the predictions, and the topocentric lunar librations appear at the lower right.
In investigations where accurate contact times are needed, the lunar limb profile can be used to correct the nominal or mean limb predictions. For any given position angle, there will be a high mountain (annular eclipses) or a low valley (total eclipses) in the vicinity that ultimately determines the true instant of contact. The difference, in time, between the Sun's position when tangent to the contact point on the mean limb and tangent to the highest mountain (annular) or lowest valley (total) at actual contact is the desired correction to the predicted contact time. On the exaggerated radial scale of Figure 1.7, the Sun's limb can be represented as an epicyclic curve that is tangent to the mean lunar limb at the point of contact. Using the digitized Watts' datum, an analytical solution is straightforward and robust. Curves of corrections to the times of second and third contact for most position angles have been computer generated and plotted. The circular protractor scale at the center represents the nominal contact time using a mean lunar limb. The departure of the contact correction curves from this scale graphically illustrates the time correction to the mean predictions for any position angle as a result of the Moon's true limb profile. Time corrections external to the circular scale are added to the mean contact time; time corrections internal to the protractor are subtracted from the mean contact time. The magnitude of the time correction at a given position angle is measured using any of the four radial scales plotted at each cardinal point.
For example, Table 1.7 gives the following data for Reykjavik, Iceland:
			Second Contact	= 04:02:27.6 UT	P2=254°
			 Third Contact	= 04:06:03.5 UT	P3=077°
Measuring the contact time corrections in Figure 1.7, the resulting contact times are:
	C2=+3.2 seconds;	Second Contact	= 04:02:27.6 +3.2s	= 04:02:30.8 UT
	C3=-5.2 seconds;	 Third Contact	= 04:06:03.5 -5.2s	= 04:05:58.3 UT
The above corrected values are within 0.1 seconds of a rigorous calculation using the true limb profile.
![]()
Adapted from:
"Annular and Total Solar Eclipses of 2003" (NASA/TP-2002-211618).Permission is freely granted to reproduce this information and data when accompanied by an acknowledgment of the source:
"From Annular and Total Solar Eclipses of 2003 by Fred Espenak and Jay Anderson, NASA"
![]()
![]()

Webmaster: Fred Espenak Planetary Systems Laboratory - Code 693 Email: Fred.Espenak-1@nasa.gov NASA/Goddard Space Flight Center, Greenbelt, Maryland 20771 USA |
|---|
Last revised: 2003 Jan 29 - F. Espenak