Annular Solar Eclipse of 2010 January 15
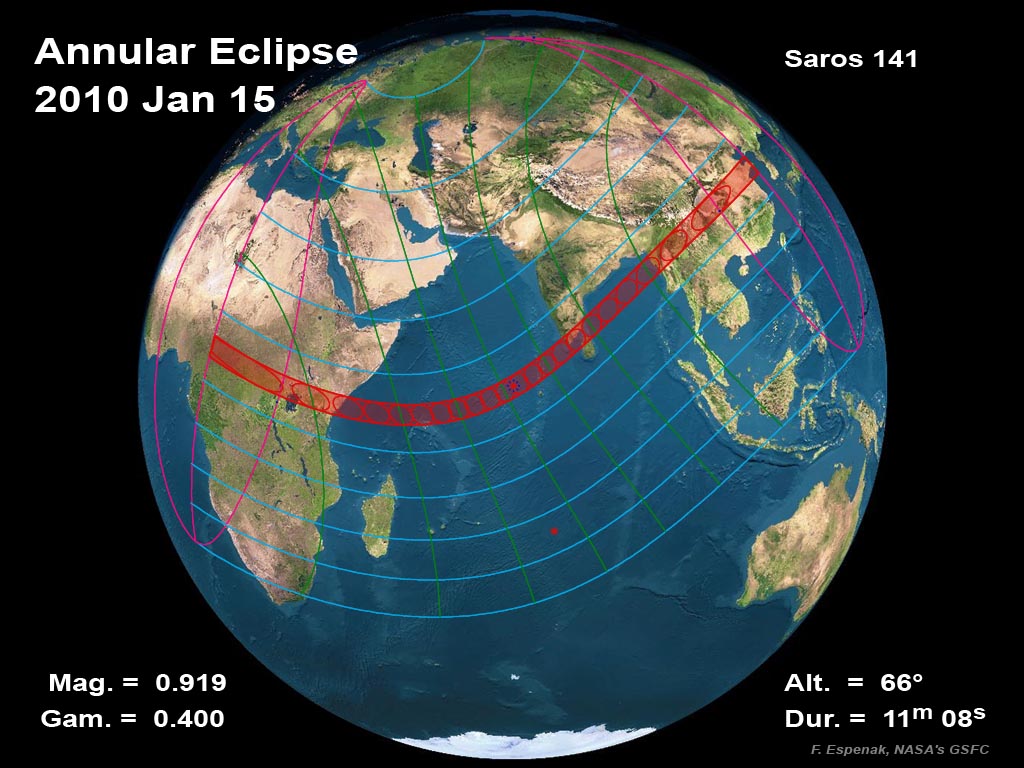
On Friday, 2010 January 15, an annular eclipse of the Sun is visible from within a 300-km-wide track that traverses half of Earth. The path of the Moon's antumbral shadow begins in Africa and passes through Chad, Central African Republic, Democratic Republic of the Congo, Uganda, Kenya, and Somalia. After leaving Africa, the path crosses the Indian Ocean where the maximum duration of annularity reaches 11 min 08 s. The central path then continues into Asia through Bangladesh, India, Burma (Myanmar), and China. A partial eclipse is seen within the much broader path of the Moon's penumbral shadow, which includes eastern Europe, most of Africa, Asia, and Indonesia.
This web site has been established for the purpose of providing detailed predictions, maps, figures and information about this important event. The material here is adapted from Annular and Total Solar Eclipses of 2010 (NASA/TP-2008-214171). The publication date of this document is 2008 December. It is part of NASA's official eclipse bulletin publication series. Instructions and a form for ordering a hard copy of this publication can be found at: Order Form for NASA Eclipse Bulletins.
A special Web site is also available for the Total Solar Eclipse of 2010 July 11.
Interactive Map of the Path of Annularity
An implementation of Google Map has been created which includes the central path of the 2010 annular solar eclipse. This allows the user to select any portion of the path and to zoom in using either map data or Earth satellite data.
General Maps of the Eclipse Path
The following maps show the overall regions of visibility of the partial eclipse as well as the path of the Annular eclipse through Africa, the Indian ocean and Asia. They use high resolution coastline data from the World Data Base II (WDB). Each map was chosen to isolate a specific region along the land portion of the eclipse path. Curves of maximum eclipse are included as well as the outline of the antumbral shadow.
The maps are available as high resolution (300 dpi) PDF files.
| Figure Number | Title/Description | Map File |
| Figure 2.1 | Orthographic (Global) Map of 2010 Annular Solar Eclipse | |
| Figure 2.2 | Path of the Annular Eclipse Through Africa | |
| Figure 2.6 | Path of the Annular Eclipse Through Asia |
From NASA Tech. Pub. Annular and Total Solar Eclipses of 2010 (NASA/TP-2008-214171).
Detailed Maps of the Path of Annularity
The following maps show path of the 2010 annular eclipse in greater detail. They use high resolution coastline, city and highway data from the Digital Chart of the World (DCW). Each map was chosen to isolate a specific region along the land portion of the eclipse path. Curves of maximum eclipse are included as well as the outline of the antumbral shadow. Within the antumbral path, curves of constant duration have been plotted for annularity.
The maps are available as high resolution (300 dpi) PDF files.
| Figure Number | Title/Description | Map File |
| Figure 2.3 | Annular Path - Central African Republic | |
| Figure 2.4 | Annular Path - Democratic Republic of the Congo | |
| Figure 2.5 | Annular Path - Kenya | |
| Figure 2.7 | Annular Path - Central Maldive Islands | |
| Figure 2.8 | Annular Path - India and Sri Lanka | |
| Figure 2.9 | Annular Path - Burma | |
| Figure 2.10 | Annular Path - Burma - China | |
| Figure 2.11 | Annular Path - China - Luzhou | |
| Figure 2.12 | Annular Path - China Enshi | |
| Figure 2.13 | Annular Path - China - Zengzhou | |
| Figure 2.14 | Annular Path - China - Linyi |
From NASA Tech. Pub. Annular and Total Solar Eclipses of 2010 (NASA/TP-2008-214171).
Maximum Detail Maps of the Path of Annularity
The following PDF format maps show the path of the 2010 annular eclipse in maximum detail at 4-degree intervals of longitude. Within the antumbral path, curves of constant duration have been plotted for the annular phase. Note that the constant duration curves are not centered on the central line. This is due to the difference between the Moon's Center of Mass (used for the central line) and the Center of Figure (used for curves of constant duration). The maps also include the general terrain highlighting major towns, cities, and highways.
These maximum detail maps were prepared by Michael Zeiler (ESRI) using a high level CAD/GIS (Computer Aided Drawing / Graphic Information System) with data provided by Fred Espenak (NASA/GSFC) and Bill Kramer (eclipse-chasers.com). The PDF files are best viewed with Adobe Reader and are designed to print on standard 8.5 x 11 inch paper (300 dpi).
| Map Number | Title/Description | Map File |
| Map 1 | Annular Path - Congo (028E to 031E) | |
| Map 2 | Annular Path - Uganda (031E to 034E) | |
| Map 3 | Annular Path - Uganda & Kenya (034E to 037E) | |
| Map 4 | Annular Path - Kenya (037E to 040E) | |
| Map 5 | Annular Path - Kenya & Somalia (040E to 043E) | |
| Map 6 | Annular Path - Maldives (072E to 075E) | |
| Map 7 | Annular Path - India (077E to 080E) | |
| Map 8 | Annular Path - Sri Lanka (080E to 082E) | |
| Map 9 | Annular Path - Bangladesh & Myanmar (092E to 095E) | |
| Map 10 | Annular Path - Myanmar & China (095E to 098E) | |
| Map 11 | Annular Path - China (098E to 101E) | |
| Map 12 | Annular Path - China (101E to 104E) | |
| Map 13 | Annular Path - China (104E to 107E) | |
| Map 14 | Annular Path - China (107E to 110E) | |
| Map 15 | Annular Path - China (110E to 113E) | |
| Map 16 | Annular Path - China (113E to 116E) | |
| Map 17 | Annular Path - China (116E to 119E) | |
| Map 18 | Annular Path - China (119E to 121E) | |
| Map 19 | Annular Path - Detail of Mt. Kenya | |
| Map 20 | Annular Path - Detail of Jaffna, Sri Lanka | |
| Map 21 | Annular Path - Detail of Kerala, India | |
| Map 22 | Annular Path - Detail of Thanjavur, India |
Additional Figures
The following figures depict the lunar limb profile, and cloudiness data along the eclipse path.
| Figure Number |
Title/Description | Figure File |
| Figure 2.15 | Lunar Limb Profile for 2010 January 15 at 07:00 UT | |
| Figure 2.16 | Average Cloudiness in January Along the Eclipse Path |
From NASA Tech. Pub. Annular and Total Solar Eclipses of 2010 (NASA/TP-2008-214171).
Eclipse Elements, Shadow Contacts and Path of Annularity
The following tables give detailed predictions including the Besselian Elements, shadow contacts with Earth, path of the antumbral shadow and topocentric data (with path corrections) along the path.
- Table 2.1 - Elements of the Eclipse
- Table 2.2 - Shadow Contacts and Circumstances
- Table 2.3 - Path of the Antumbral Shadow
- Table 2.4 - Physical Ephemeris of the Antumbral Shadow
- Table 2.5 - Local Circumstances on the Central Line
- Table 2.6 - Topocentric Data and Path Corrections Due to Lunar Limb Profile
From NASA Tech. Pub. Annular and Total Solar Eclipses of 2010 (NASA/TP-2008-214171).
Coordinate Tables for the Path of Annularity
The following tables do not appear in the NASA 2010 Eclipse Bulletin due to page constraints. The tables provide detailed coordinates for the path of the antumbral shadow as well as the zones of grazing eclipse. They are listed in a format convenient for plotting on maps.
- Table 2.A - Mapping Coordinates for the Antumbral Path
- Table 2.B - Mapping Coordinates for the Antumbral Path (Extended - 7.5´ step size)
- Table 2.C - Mapping Coordinates for the Zones of Grazing Eclipse
- Table 2.D - Mapping Coordinates for the Zones of Grazing Eclipse (Extended - 7.5´ step size)
Local Circumstances
The following tables give the local circumstances of the eclipse from various cities throughout the Eastern Hemisphere. All contact times are given in the tables are in Universal Time.
- Table 2.7 - Local Circumstances for Africa: Angola to Libya
- Table 2.8 - Local Circumstances for Africa: Madagascar to Zimbabwe
- Table 2.9 - Local Circumstances for Europe
- Table 2.10 - Local Circumstances for Japan
- Table 2.11 - Local Circumstances for the Middle East
- Table 2.12 - Local Circumstances for Central Asia
- Table 2.13 - Local Circumstances for South Asia
- Table 2.14 - Local Circumstances for Southeast Asia
- Table 2.15 - Local Circumstances for China, and North and South Korea
From NASA Tech. Pub. Annular and Total Solar Eclipses of 2010 (NASA/TP-2008-214171).
Additional Tables
The following tables also appear in the <Annular and Total Solar Eclipses of 2010 (NASA/TP-2008-214171).
- Table 2.16 - Climate Statistics for January Along the Annular Eclipse Path
- Tables 4.1 & 4.2 - Eclipse Photography
Explanation of Eclipse Maps and Tables
The following links give detailed descriptions and explanations of the eclipse maps and tables.
- Map 2.1 - Orthographic Map of the Eclipse Path
- Table 2.1 - Elements of the Eclipse
- Table 2.2 - Shadow Contacts and Circumstances
- Table 2.3 - Path of the Umbral (or Antumbral) Shadow
- Table 2.4 - Physical Ephemeris of the Umbral (or Antumbral) Shadow
- Table 2.5 - Local Circumstances on the Central Line
- Table 2.6 - Topocentric Data and Path Corrections Due to Lunar Limb Profile
- Table 2.A & 2.B - Mapping Coordinates for the Central Path
- Table 2.C & 2.D - Coordinates for the Zones of Grazing Eclipse
- Mean Lunar Radius
- Lunar Limb Profile
- Limb Corrections to the Path Limits: Graze Zones
- Local Circumstances Tables for Annular Solar Eclipses
Reproduction of Eclipse Data
All eclipse calculations are by Fred Espenak, and he assumes full responsibility for their accuracy. Permission is freely granted to reproduce this data when accompanied by an acknowledgment:
"Eclipse Predictions by Fred Espenak, NASA's GSFC"
For more information, see: NASA Copyright Information
Acknowledgments
Special thanks to Solar Eclipse Mailing List moderator Michael Gill for proof reading and testing links on the ASE2010 Web page.
