Total Solar Eclipse of 2008 August 01
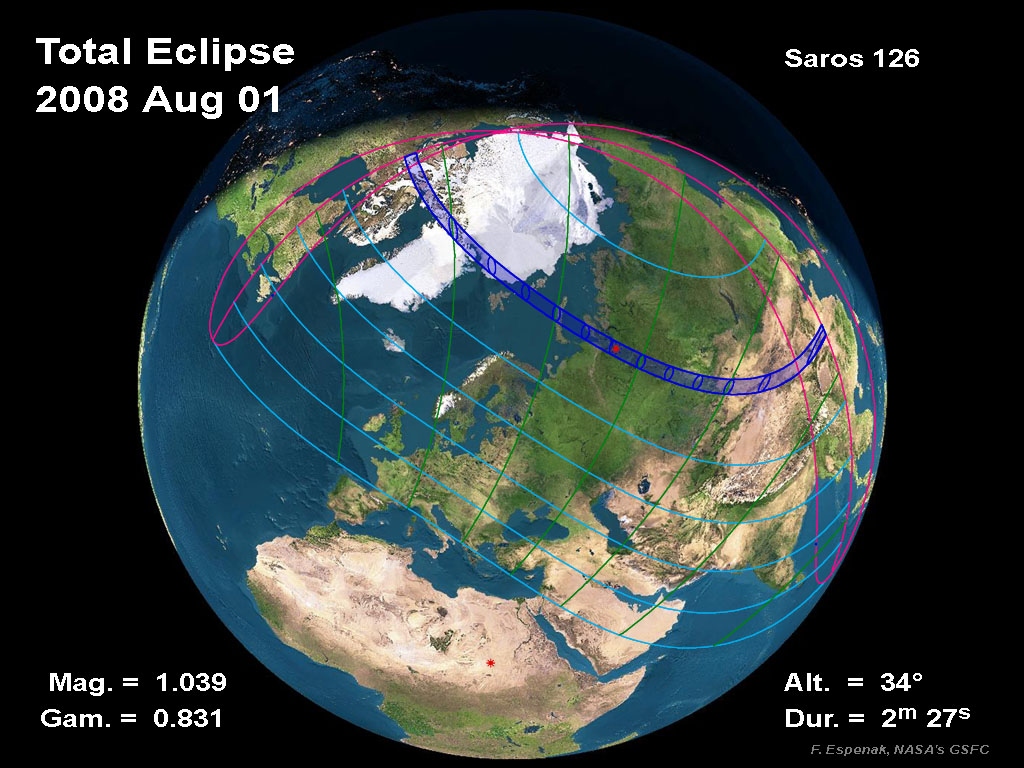
On Friday, 2008 August 01, a total eclipse of the Sun is visible from within a narrow corridor that traverses half the Earth. The path of the Moon's umbral shadow begins in Canada and extends across northern Greenland, the Arctic, central Russia, Mongolia, and China. A partial eclipse is seen within the much broader path of the Moon's penumbral shadow, which includes northeastern North America, most of Europe and Asia.
This web site has been established for the purpose of providing detailed predictions, maps, figures and information about this important event. The material here is adapted from the NASA Technical Publication "Total Solar Eclipse of 2008 August 01" (NASA/TP-2007-214149). The document was published in 2007 March and is now available for distribution in hard copy and as a high resolution (11 MB) PDF file . It is part of NASA's official eclipse bulletin publication series. Instructions and a form for ordering a hard copy of this publication can be found at: Order Form for NASA Eclipse Bulletins.
Preliminary Look at the Total Solar Eclipse of 2008 August 01
(presented at: IAU Symposium 233 - Solar Activity and Its Magnetic Origin)- Figure 1 - Orthographic (Global) Projection of the 2008 Total Solar Eclipse
- Figure 2 - Overview of the 2008 Eclipse Path
- Figure 3 - 2008 Eclipse Path Through Nunavut, Canada
- Figure 4 - 2008 Eclipse Path Through Greenland, the Arctic and Northern Russia
- Figure 5 - 2008 Eclipse Path Through Russia
- Figure 6 - 2008 Eclipse Path Through Mongolia and China
- Figure 7 - Mean Cloudiness in August Along the 2008 Eclipse Path (from satellite imaging)
- Figure 8 - Mean Cloudiness in August Along the Eclipse Path Through Asia (from satellite imaging)
- Figure 9 - Mean Cloudiness in August Along the Eclipse Path Through China and Mongolia (from satellite imaging)
- Figure 10 - Climate Statistics for July/August Along the 2008 Eclipse Path
- Figure 11 - Average August Cloudiness Along the 2008 Eclipse Path
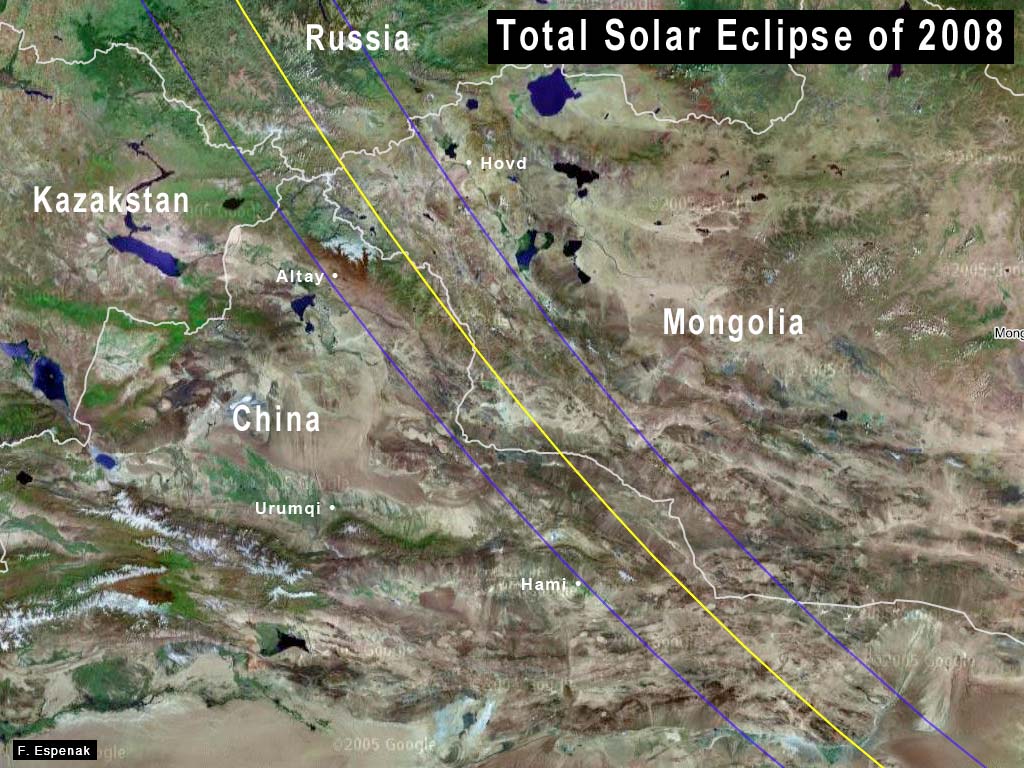
- Figure 12 - Close-Up of 2008 Eclipse Path Through China and Mongolia (Google Earth)
This data presented at: IAU Symposium 233 - Solar Activity and Its Magnetic Origin
See also: Eclipse Weather and Maps (Jay Anderson)
Google Map of the Path of Totality
An implementation of Google Map has been created which includes the central path of the 2008 total solar eclipse. This allows the user to sellect any portion of the path and to zoom in using either map data or Earth satellite data.
General Maps of the Eclipse Path
The following maps show the overall regions of visibility of the partial eclipse as well as the path of the total eclipse through North America, Europe and Asia. They use high resolution coastline data from the World Data Base II (WDB). Each map was chosen to isolate a specific region along the land portion of the eclipse path. Curves of maximum eclipse are included as well as the outline of the umbral shadow.
Each map is available in two resolutions: 'Low' (web resolution) and 'High' (300 dpi print resolution). You may need to set your printer to 25% reduction in order to print 'High' resolution figures on a single page.
| Figure Number | Title/Description | Low Resolution | High Resolution |
| Figure 1 | Orthographic (Global) Map of 2008 Total Solar Eclipse | Low | High |
| Figure 2 | Stereographic Projection Map of the 2008 Eclipse | Low | High |
| Figure 3 | Map of 2008 Eclipse Path Through Canada and Greenland | Low | High |
| Figure 7 | Map of 2008 Eclipse Path Through Asia | Low | High |
From NASA Tech. Pub. "Total Solar Eclipse of 2008 August 01" (NASA/TP-2007-214149).
Detailed Maps of the Path of Totality
The following maps show path of the 2008 total eclipse in greater detail. They use high resolution coastline, city and highway data from the Digital Chart of the World (DCW). Each map was chosen to isolate a specific region along the land portion of the eclipse path. Curves of maximum eclipse are included as well as the outline of the umbral shadow. Within the umbral path, curves of constant duration have been plotted for totality.
Each map is available in two resolutions: 'Low' (web resolution) and 'High' (300 dpi print resolution). You may need to set your printer to 25% reduction in order to print 'High' resolution figures on a single page.
| Figure Number |
Title/Description | Low Resolution |
High Resolution |
| Figure 4 | Arctic Canada | Low | High |
| Figure 5 | Arctic Canada and Greenland | Low | High |
| Figure 6 | Svalbard & Frans Josef Land | Low | High |
| Figure 8 | Russia - Noyaya Zemlya | Low | High |
| Figure 9 | Russia - Nadym | Low | High |
| Figure 10 | Russia - Central Siberia | Low | High |
| Figure 11 | Russia - Novosibirsk | Low | High |
| Figure 12 | China, Russia & Mongolia | Low | High |
| Figure 13 | China & Mongolia | Low | High |
| Figure 14 | China (Wuwei) | Low | High |
| Figure 15 | China (Xian) | Low | High |
From NASA Tech. Pub. "Total Solar Eclipse of 2008 August 01" (NASA/TP-2007-214149).
Additional Figures
The following figures also appear in the NASA Tech. Pub. "Total Solar Eclipse of 2008 August 01" (NASA/TP-2007-214149)
| Figure Number |
Title/Description | Low Resolution |
High Resolution |
| Figure 16 | Lunar Limb Profile for August 01 at 11:00 UT | Low | High |
| Figure 17 | Average August Cloud Amount Along the Central Line | Low | High |
| Figure 18 | Spectral Response of Common Solar Filters | Low | High |
| Figure 19 | Focal Length Vs. Image Size for Eclipse Photography | Low | High |
| Figure 20 | Sky During Totality: Central Line at 11:00 UT | Low | High |
From NASA Tech. Pub. "Total Solar Eclipse of 2008 August 01" (NASA/TP-2007-214149).
Eclipse Elements, Shadow Contacts and Path of Totality
The following tables give detailed predictions including the Besselian Elements, shadow contacts with Earth, path of the umbral shadow and topocentric data (with path corrections) along the path. Also included are special extended version tables of path coordinates and graze zones in formats convenient for plotting on maps.
- Table 1 - Elements of the Eclipse
- Table 2 - Shadow Contacts and Circumstances
- Table 3 - Path of the Umbral Shadow
- Table 4 - Physical Ephemeris of the Umbral Shadow
- Table 5 - Local Circumstances on the Central Line
- Table 6 - Topocentric Data and Path Corrections Due to Lunar Limb Profile
- Table 7a - Mapping Coordinates for the Umbral Path
- Table 7b - Mapping Coordinates for the Umbral Path (Extended - 7.5´ step size)
- Table 8a - Mapping Coordinates for the Zones of Grazing Eclipse
- Table 8b - Mapping Coordinates for the Zones of Grazing Eclipse (Extended - 7.5´ step size)
From NASA Tech. Pub.
"Total Solar Eclipse of 2008 August 01" (NASA/TP-2007-214149).
Note that Tables 7b and 8b are supplementary extended tables which do not appear in NASA/TP-2007-214149.
The tables above are updated versions of the ones published in NASA/TP-2007-214149. They include a nutation correction to Besselian element "Mu[0]" and use an updated value for ΔT of 65.6 seconds.
Local Circumstances
The following tables give the local circumstances of the eclipse from various cities throughout North America, Europe, and Asia. These tables have a lot of columns and, consequently, are quite wide. To print them, set the paper orientation of your printer to "landscape" and set the scale to about 60%. All contact times are given in the tables are in Universal Time.
- Tables 09 & 10 - Local Circumstances for Canada, North Atlantic & United Kingdom
- Table 11 - Local Circumstances for Europe - Albania to Italy
- Table 12 - Local Circumstances for Europe - Latvia to Ukraine
- Table 13 - Local Circumstances for Russia
- Table 14 - Local Circumstances for Asia Minor
- Table 15 - Local Circumstances for Asia
- Table 16 - Local Circumstances for China
From NASA Tech. Pub. "Total Solar Eclipse of 2008 August 01" (NASA/TP-2007-214149).
Additional Tables
The following figures also appear in the NASA Tech. Pub. "Total Solar Eclipse of 2008 August 01" (NASA/TP-2007-214149)
- Table 17 - Solar Eclipses of Saros Series 126
- Table 18 - Cloud Cover Statistics for August Along the Eclipse Path
- Table 19 - Climate Statistics for August Along the Eclipse Path
- Tables 20 & 21 - Eclipse Photography
Explanation of Eclipse Maps and Tables
The following links give detailed descriptions and explanations of the eclipse maps and tables.
- Map 1 - Orthographic Map of the Eclipse Path
- Table 1 - Elements of the Eclipse
- Table 2 - Shadow Contacts and Circumstances
- Table 3 - Path of the Umbral (or Antumbral) Shadow
- Table 4 - Physical Ephemeris of the Umbral (or Antumbral) Shadow
- Table 5 - Local Circumstances on the Central Line
- Table 6 - Topocentric Data and Path Corrections Due to Lunar Limb Profile
- Table 7 - Mapping Coordinates for the Central Path
- Table 8 - Coordinates for the Zones of Grazing Eclipse
- Mean Lunar Radius
- Lunar Limb Profile
- Limb Corrections to the Path Limits: Graze Zones
- Local Circumstances Tables for Total Solar Eclipses

Click Here for Live Webcast of the 2008 eclipse!
Live Web Coverage of the 2008 Total Solar Eclipse
The following links will provide live web coverage of the 2008 eclipse. (check for more links in July 2008)
- Live Webcast (CHINA) - NASA Sun-Earth Connection.
- Live Webcast (CHINA) - Exploratorium.
- Live Webcast (Xian, CHINA) - U. of North Dakota.
- Live Webcast (Novosibirsk, RUSSIA) - NovosibirskGuide.com.
- SunEarth Day Podcasts - Podcasts about the 2008 eclipse (including interviews with Fred Espenak)
- University of North Dakota SEMS Webcast (Xian, CHINA)
- Taiwan Webcast Group Webcast (Mainland CHINA)
- LIVE! UNIVERSE, Japan Webcast (Novosibirsk, RUSSIA)
Reproduction of Eclipse Data
All eclipse calculations are by Fred Espenak, and he assumes full responsibility for their accuracy. Permission is freely granted to reproduce this data when accompanied by an acknowledgment:
"Eclipse Predictions by Fred Espenak, NASA's GSFC"
For more information, see: NASA Copyright Information
