|
|---|
|
|
|---|
On Wednesday, 2002 December 04, a total eclipse of the Sun will be visible from within a narrow corridor which traverses the Southern Hemisphere. The path of the Moon's umbral shadow begins in the South Atlantic and crosses southern Africa. After traversing the southern Indian Ocean, the path sweeps through southern Australia where the eclipse ends at sunset. A partial eclipse will be seen within the much broader path of the Moon's penumbral shadow, which includes most of Africa (excluding the north), parts of Indonesia, Australia and eastern Antarctica.This web site has been established for the purpose of providing detailed predictions, maps, figures and information about this historic event. The material here is adapted from NASA TP 2001-209990 "Total Solar Eclipse of 2002 December 04". This publication will be available for distribution in October 2001. It is part of NASA's official eclipse bulletin publication series. Instructions and a form for ordering a hard copy of this publication can be found at:
Order Form for NASA Eclipse Bulletins Additional and supplemental material for the 2002 eclipse will be published here in the coming months.
See a Computer Animation the 2002 Solar Eclipse Path.
The following maps show the overall regions of visibility of the partial eclipse as well as the path of the total eclipse through Africa and Australia. They use high resolution coastline data from the World Data Base II (WDB). Each map was chosen to isolate a specific region along the land portion of the eclipse path. Curves of maximum eclipse and constant eclipse magnitude are included as well as the outline of the umbral shadow. City data from a geographic data base of over 90,000 positions are plotted to give as many locations as possible in the path of totality.
Each map is available in two resolutions: 'Low' (web resolution) and 'High' (300 dpi print resolution). You may need to set your printer to 25% reduction in order to print 'High' resolution figures on a single page.
| Figure Number | Title/Description | Low Resolution | High Resolution |
|---|---|---|---|
| Figure 1 | Orthographic (Global) Map of 2002 Total Solar Eclipse | Low | High |
| Figure 2 | 2002 Total Eclipse Path Through Africa | Low | High |
| Figure 3 | 2002 Total Eclipse Path Through Western Africa | Low | High |
| Figure 4 | 2002 Total Eclipse Path Through Eastern Africa | Low | High |
| Figure 12 | 2002 Total Eclipse Path Through Australia | Low | High |
| Figure 13 | 2002 Total Eclipse Path Through Southern Australia | Low | High |
These figures are adapted from NASA TP 2001-209990 "Total Solar Eclipse of 2002 December 04".
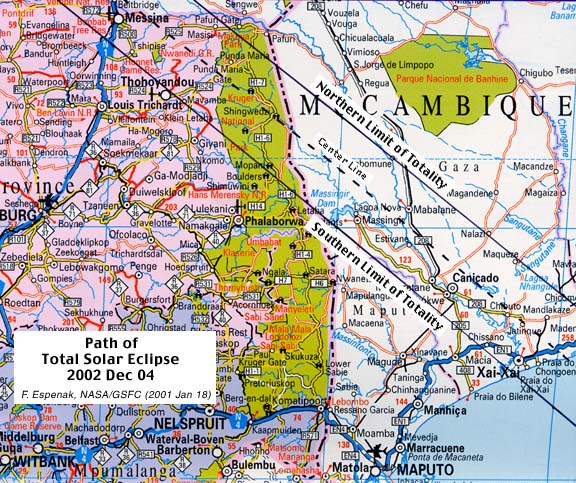
The path of totality has been plotted on a set of eleven detailed maps. The maps are constructed from the Digital Chart of the World (DCW), a digital database of the world developed by the U.S. Defense Mapping Agency (DMA). The primary sources of information for the geographic database are the Operational Navigation Charts (ONC) and the Jet Navigation Charts (JNC) developed by the DMA. When printed at 300 dpi, the scale of the high resolution maps is 1:2,000,000. At this scale, the maps show roads, cities and villages, lakes and rivers, suitable for eclipse expedition planning.
Each map is available in two resolutions: 'Low' (web resolution) and 'High' (300 dpi print resolution). You may need to set your printer to 25% reduction in order to print 'High' resolution figures on a single page.
| Figure Number | Title/Description | Low Resolution | High Resolution |
|---|---|---|---|
| Figure 5 | 2002 Eclipse Path - Western Angola | Low | High |
| Figure 6 | 2002 Eclipse Path - Central Angola | Low | High |
| Figure 7 | 2002 Eclipse Path - Eastern Angola | Low | High |
| Figure 8 | 2002 Eclipse Path - Caprivi Strip | Low | High |
| Figure 9 | 2002 Eclipse Path - Botswana & Zimbabwe | Low | High |
| Figure 10 | 2002 Eclipse Path - Zimbabwe & South Africa | Low | High |
| Figure 11 | 2002 Eclipse Path - Mozambique | Low | High |
| Figure 14 | 2002 Eclipse Path - Ceduna, Australia | Low | High |
| Figure 15 | 2002 Eclipse Path - Woomera, Australia | Low | High |
| Figure 16 | 2002 Eclipse Path - Lyndhurst, Australia | Low | High |
| Figure 17 | 2002 Eclipse Path - Tickalara, Australia | Low | High |
These figures are adapted from NASA TP 2001-209990 "Total Solar Eclipse of 2002 December 04".
Additional maps of the path of totality are found below.
| Title/Description | Low Resolution | High Resolution |
|---|---|---|
| 2002 Eclipse Path - Kruger National Park (SA) | Low | - |
The following tables give detailed predictions including the Besselian Elements, shadow contacts with Earth, path of the umbral shadow and topocentric data (with path corrections) along the path. Also included are special extended version tables of path coordinates and graze zones in formats convenient for plotting on maps.
The following table contains detailed coordinates of the path of the total eclipse and zones of grazing eclipse through Africa and Australia. The coordinates are provided in equal steps in longitude to aid in plotting the path on maps.
Just eighteen months after the 2001 eclipse the Moon's shadow returns to southern Africa. The shift in season marks a dramatic change in the weather, for where 2001's eclipse occurred during the dry southern winter, that of 2002 is in the midst of the wet summer.
This time around, Australia offers a tempting alternative to the African rainy season, but the choices presented to the observer will be difficult to reconcile. In Australia, better weather prospects come at the cost of a short eclipse and a very low solar altitude that will magnify the effects of any cloud that might be present. If we make the reasonable assumption that there is a one-third chance that scattered cloud will block the Sun and a two-thirds chance for broken cloud, then the chances of seeing the eclipse will range from about 55% on the coast to about 65% inland.
All in all, the prospects for a successful horizon eclipse in Australia likely exceed the best chances in Africa by about five to eight percent.
Each figure below is available in two resolutions: 'Low' (web resolution) and 'High' (300 dpi print resolution). You may need to set your printer to 25% reduction in order to print 'High' resolution figures on a single page.
| Figure Number | Title/Description | Low Resolution | High Resolution |
|---|---|---|---|
| Figure 19 | Global Pressure and Weather Systems | Low | High |
| Figure 20 | Map - Mean Cloudiness Along Eclipse Path | Low | High |
| Figure 21 | Graph - Mean Cloudiness Along Eclipse Path | Low | High |
| Figure 22 | Clear Skies in Australia | Low | High |
These figures are adapted from NASA TP 2001-209990 "Total Solar Eclipse of 2002 December 04".
During 2002 total solar eclipse, the Sun is in southern Ophiuchus. Depending on the geographic location, as many as four naked eye planets and a number of bright stars will be above the horizon within the umbral path. The figures below depict the appearance of the sky during totality as seen from the center line at different locations.
The most conspicuous planet visible during totality will be Venus (mv=-4.5) located 39° west of the Sun in Virgo. Mars (mv=+1.7) is one and a half degrees west of Venus, but offers a much more difficult target since it will be nearly 500 times fainter. From Zimbabwe, the pair will appear 70° high in the northeast. Compared to Venus, Jupiter (mv=-2.2) is the next brightest planet but it will be located in the northwestern sky 114° away from the Sun. None of these planets will be visible from Australia since they all set hours before totality begins. However, Mercury (mv=-0.6) should be discernible from most places along the eclipse track. The innermost planet lies 11° east of the Sun. Since it is nearly at opposition, Saturn (mv=-0.1) will be below the horizon for most locations along the umbral path.
A number of the bright stars may also be visible during totality. Antares (mv=+1.06) is 5° south of the Sun while Arcturus (mv=-0.05) stands 55° to the northwest. Spica (mv=+0.98) lies 10° west of Venus and Mars. Finally, the great southern stars Alpha (mv=+0.14) and Beta (mv=+0.58) Centauri are 45° south of the Sun. Star visibility requires a very dark and cloud free sky during totality.
Each figure is available in two resolutions: 'Low' (web resolution) and 'High' (300 dpi print resolution). You may need to set your printer to 25% reduction in order to print 'High' resolution figures on a single page.
| Figure Number | Title/Description | Low Resolution | High Resolution |
|---|---|---|---|
| Figure 24 | Sky During Totality - 06:15 UT (western Zimbabwe) | Low | High |
| - | Sky During Totality - 09:11 UT (southern Australia) | Low | High |
These figures are adapted from NASA TP 2001-209990 "Total Solar Eclipse of 2002 December 04".
The limb profile of the Moon determines the appearance and duration of Baily's beads. The profile is also required in predicting the exact times of second and third contact, and the actual duration of totality.
Each figure is available in two resolutions: 'Low' (web resolution) and 'High' (300 dpi print resolution). You may need to set your printer to 25% reduction in order to print 'High' resolution figures on a single page.
| Figure Number | Title/Description | Low Resolution | High Resolution |
|---|---|---|---|
| Figure 18 | Lunar Limb Profile - 06:15 UT (western Zimbabwe) | Low | High |
| - | Lunar Limb Profile - 09:11 UT (southern Australia) | Low | High |
These figures are adapted from NASA TP 2001-209990 "Total Solar Eclipse of 2002 December 04".
The partial phases of a solar eclipse may only be viewed safely when using a specially manufactured solar filter.
The following figure is available in two resolutions: 'Low' (web resolution) and 'High' (300 dpi print resolution). You may need to set your printer to 25% reduction in order to print the 'High' resolution figure on a single page.
| Figure Number | Title/Description | Low Resolution | High Resolution |
|---|---|---|---|
| Figure 23 | Spectral Response of Some Solar Filters | Low | High |
This figure is adapted from NASA TP 2001-209990 "Total Solar Eclipse of 2002 December 04".
In December 2002, these links will provide live web coverage of the eclipse.
Permission is freely granted to reproduce this information and data when accompanied by an acknowledgment of the source:"Eclipse predictions (maps) courtesy of Fred Espenak, NASA/GSFC" If you have comments, suggestions, corrections and/or additions, please send them (along with the URL address of this page) to Fred Espenak

Eclipse Predictions & WebMaster: Fred Espenak e-mail: espenak@gsfc.nasa.gov Official NASA Representative: Dr. Drake Deming
Planetary Systems Branch - Code 693
|
|---|