Total Solar Eclipse of 2006 March 29
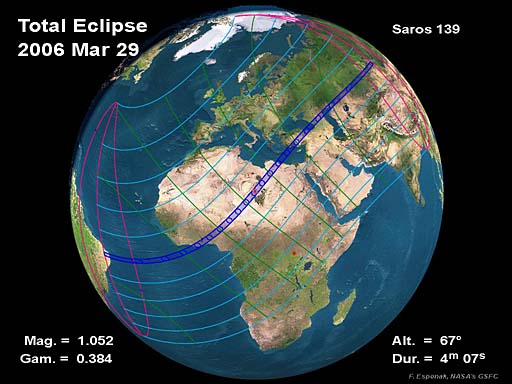
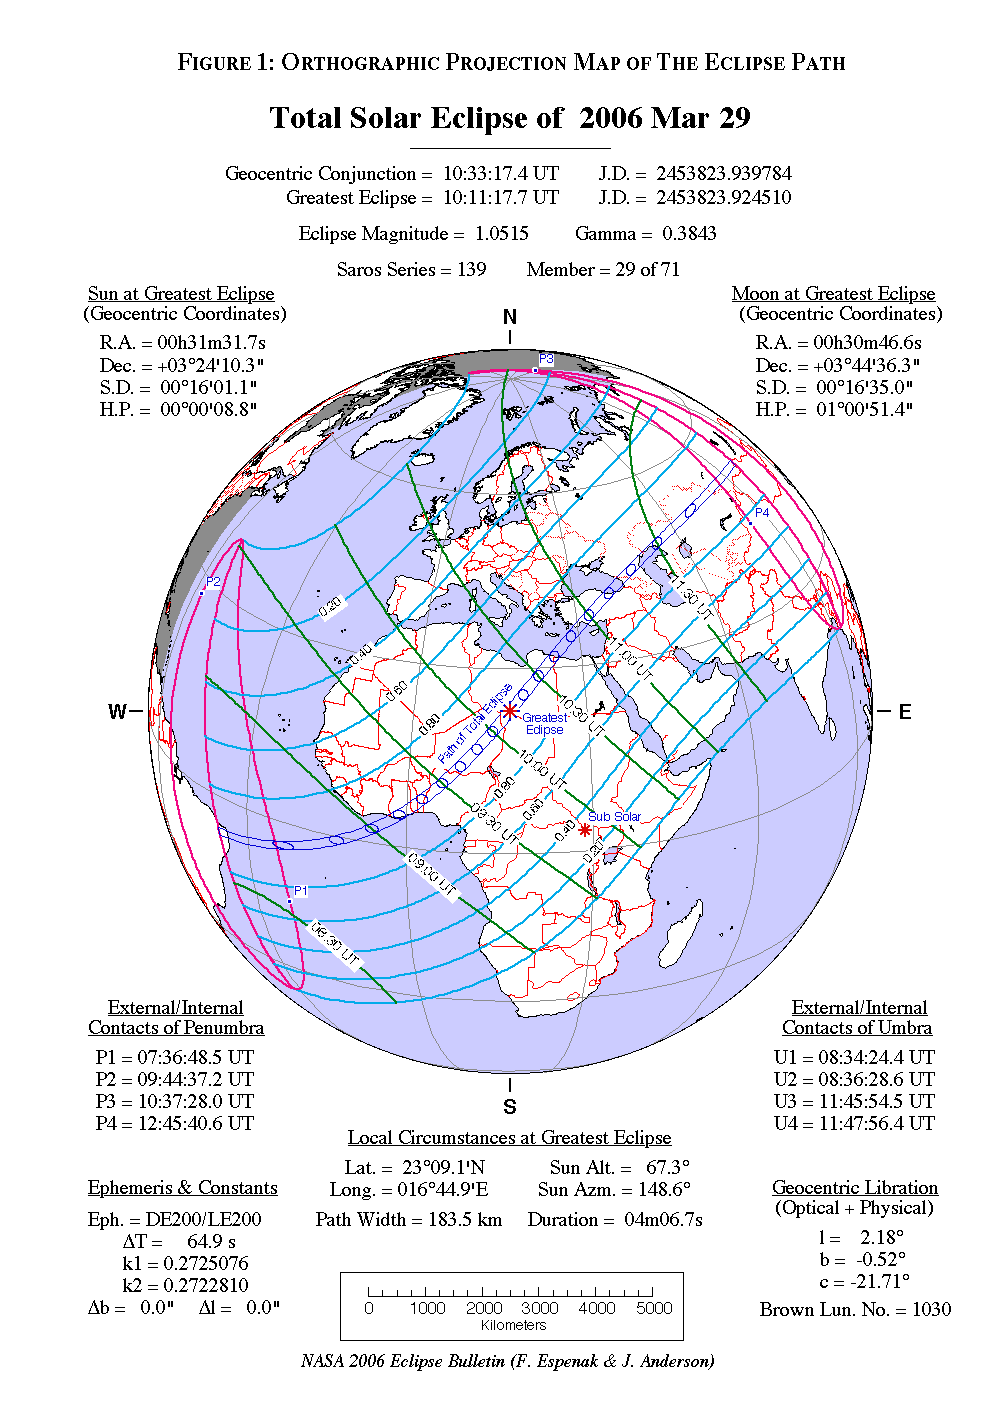
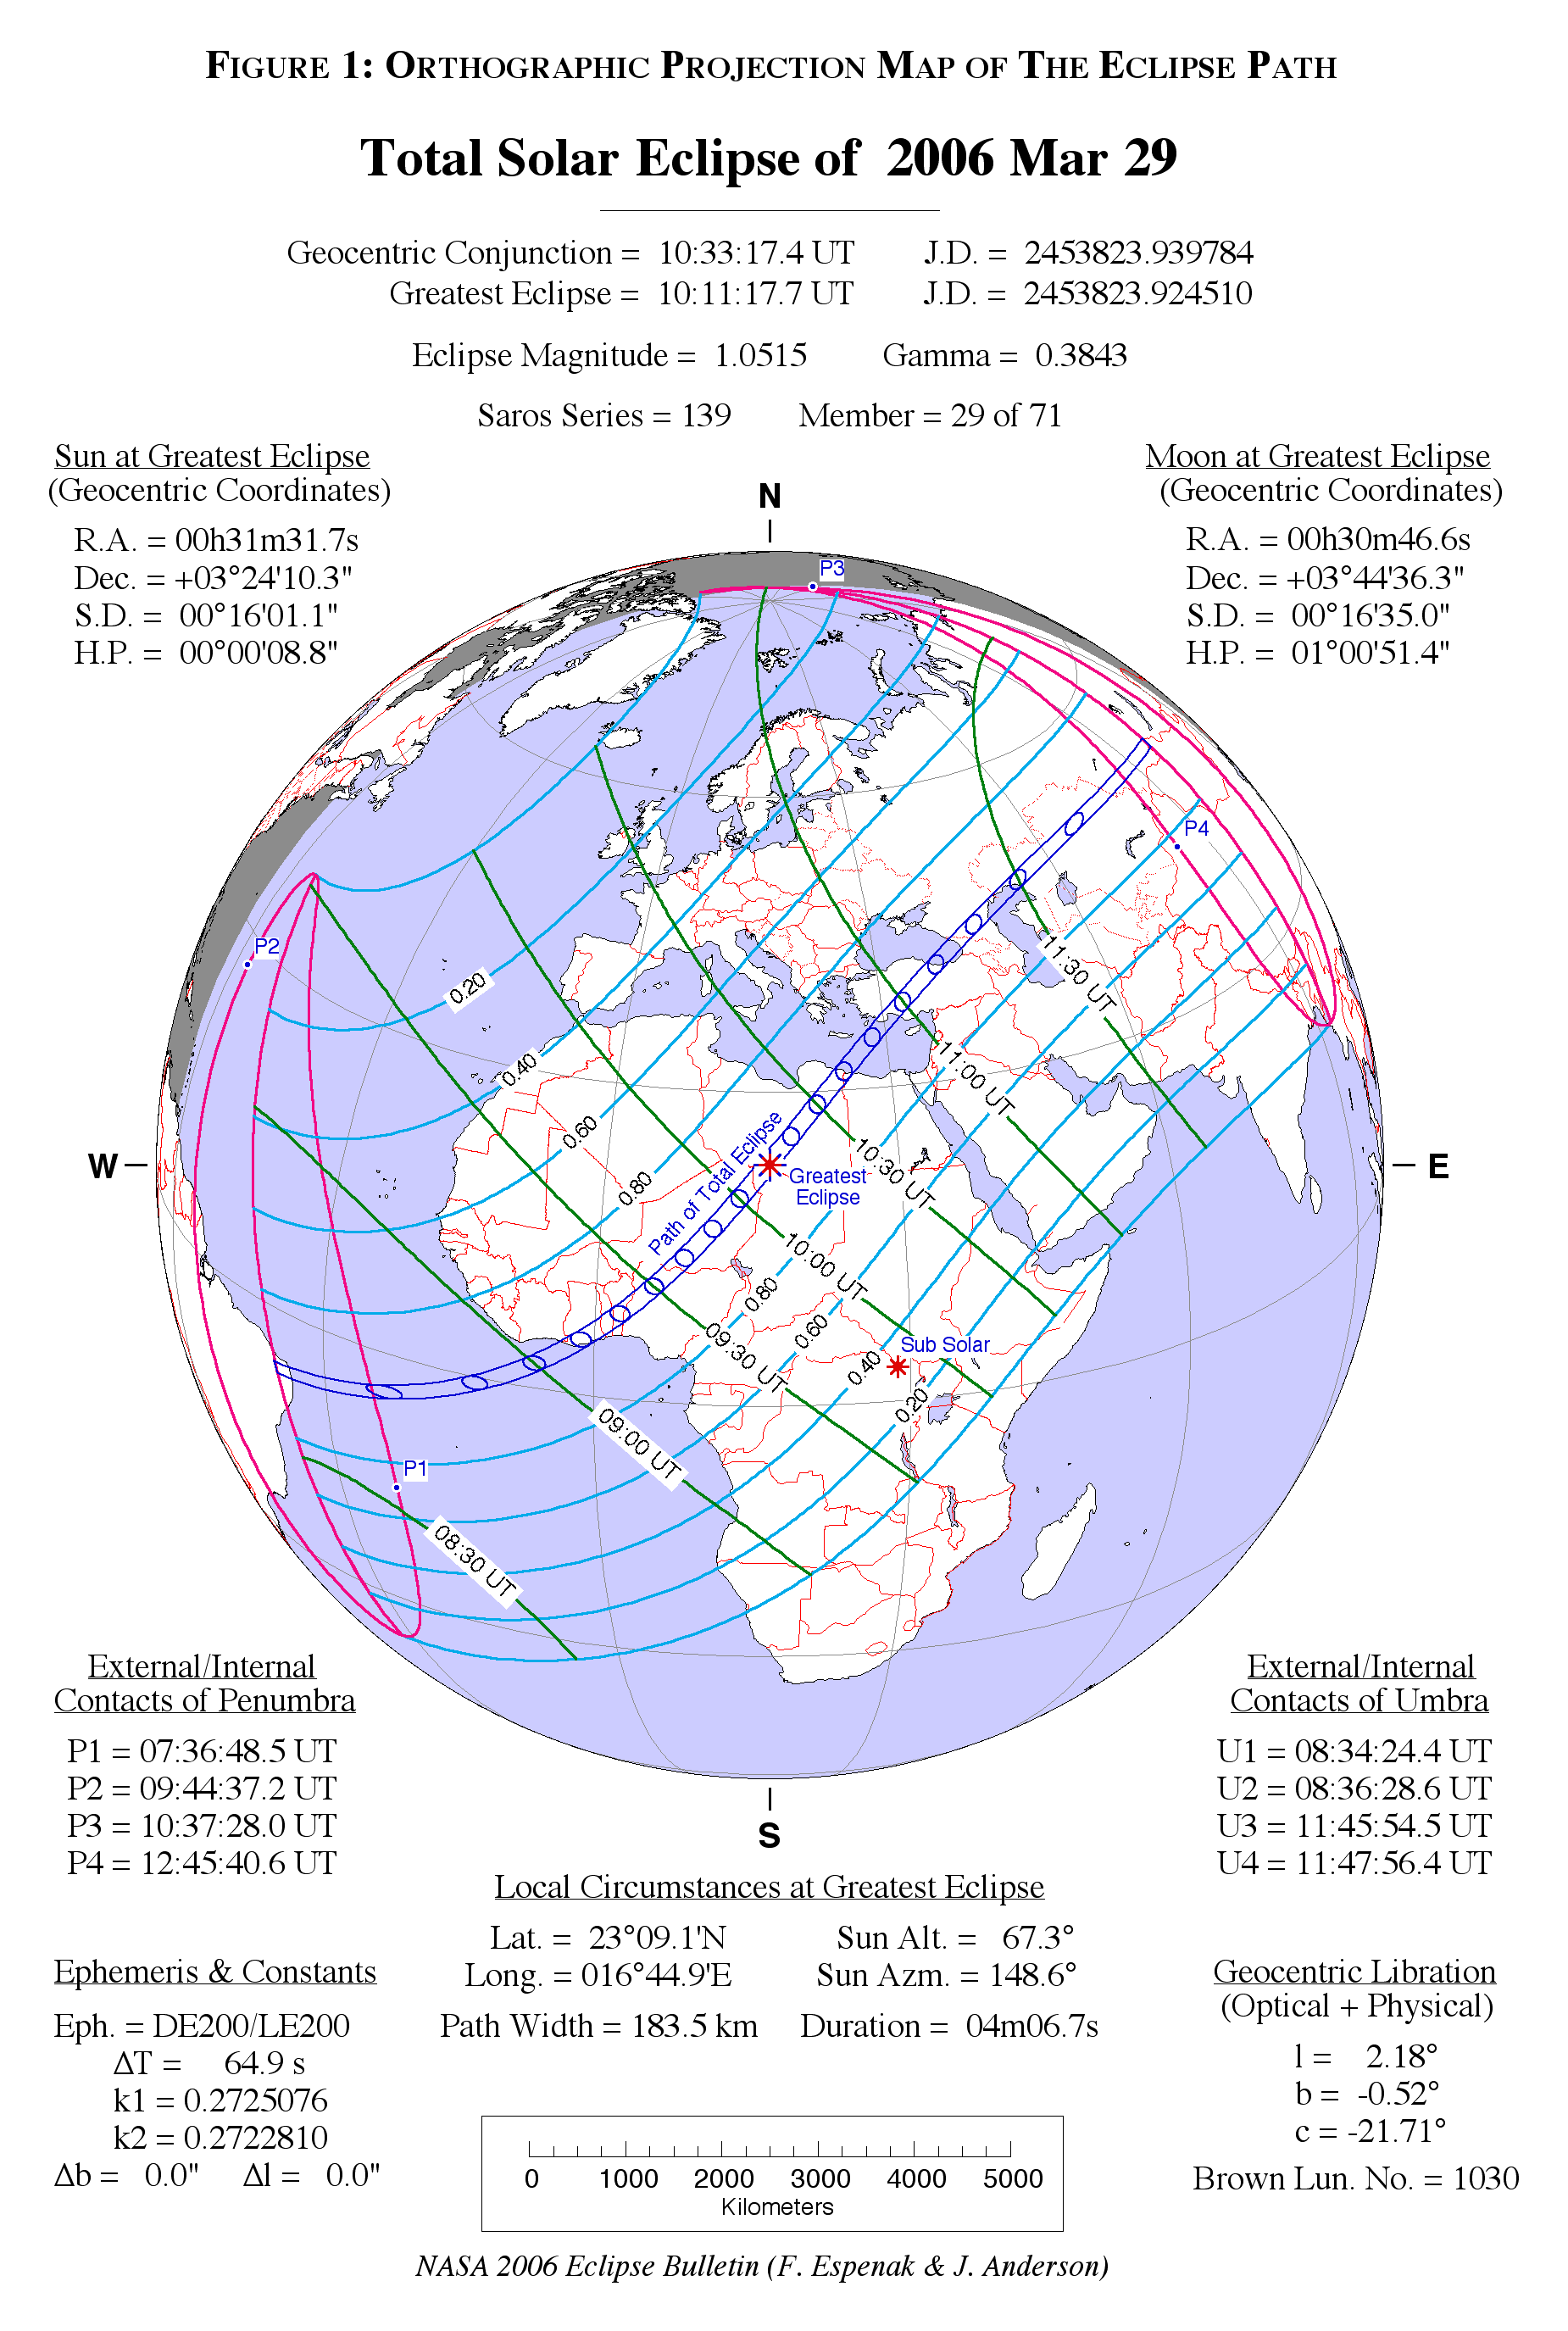
On Wednesday, 2006 March 29, a total eclipse of the Sun will be visible from within a narrow corridor which traverses half the Earth. The path of the Moon's umbral shadow begins in Brazil and extends across the Atlantic, northern Africa, and central Asia where it ends at sunset in western Mongolia. A partial eclipse will be seen within the much broader path of the Moon's penumbral shadow, which includes the northern two thirds of Africa, Europe, and central Asia.
This web site has been established for the purpose of providing detailed predictions, maps, figures and information about this important event. The material here is adapted from the NASA Technical Publication "Total Solar Eclipse of 2006 March 29" (NASA/TP-2004-212762). The document was published in 2004 November and is now available for distribution in hard copy and as either a low resolution (5 MB) or high resolution (27 MB) PDF file . It is part of NASA's official eclipse bulletin publication series. Instructions and a form for ordering a hard copy of this publication can be found at: Order Form for NASA Eclipse Bulletins.
NASA Goddard's Solar Data Analysis Center has made the complete 2006 total eclipse bulletin available online as a series of separate web pages, figures and tables. The link to the main page is: Total Solar Eclipse of 2006 March 29 .
Additional and supplemental material for the 2006 eclipse will be published here in the coming months.

NASA Sun-Earth Day 2006 - Eclipse, in a Different Light
General Maps of the Eclipse Path
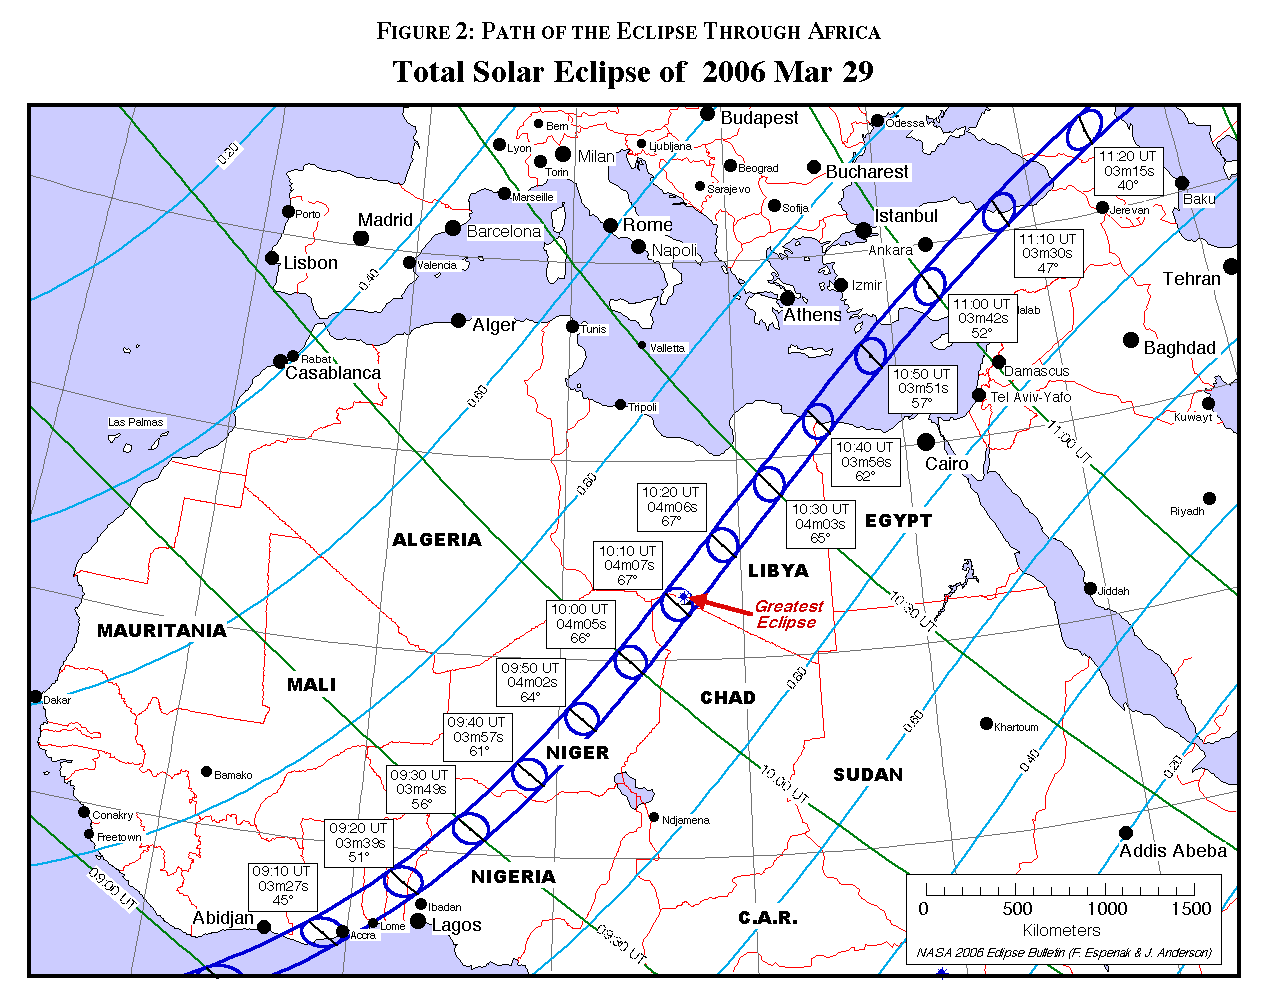
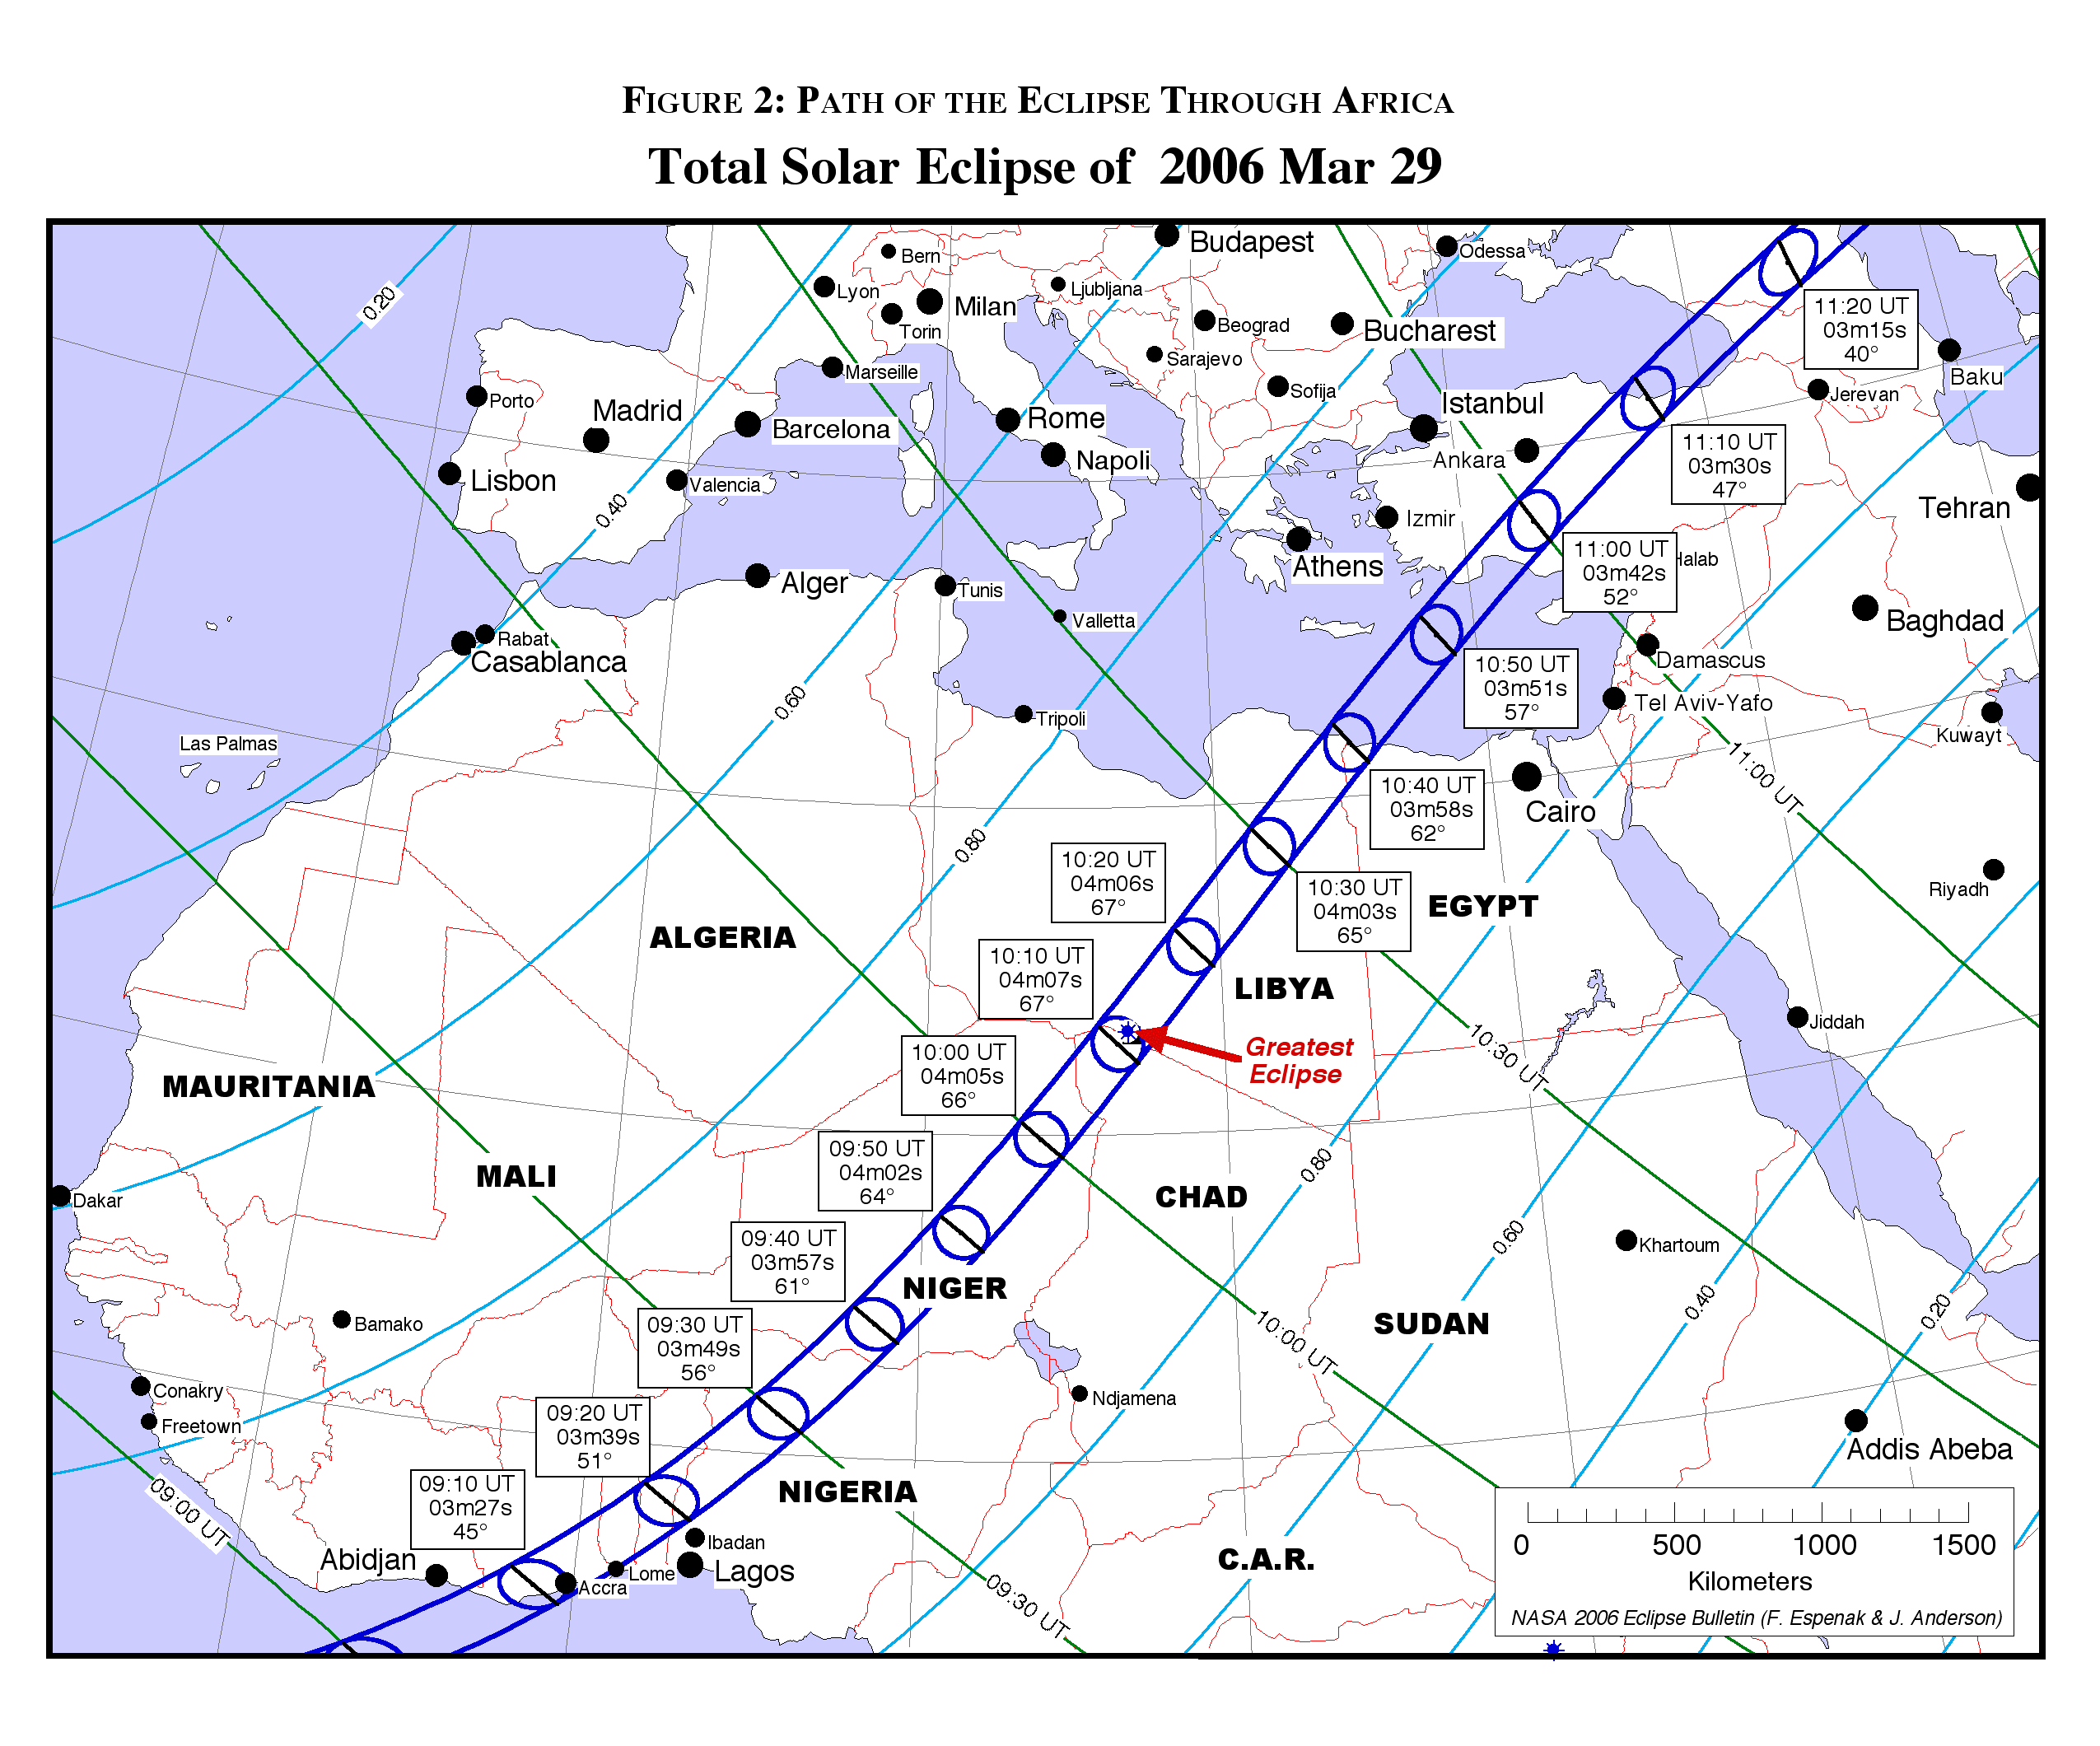
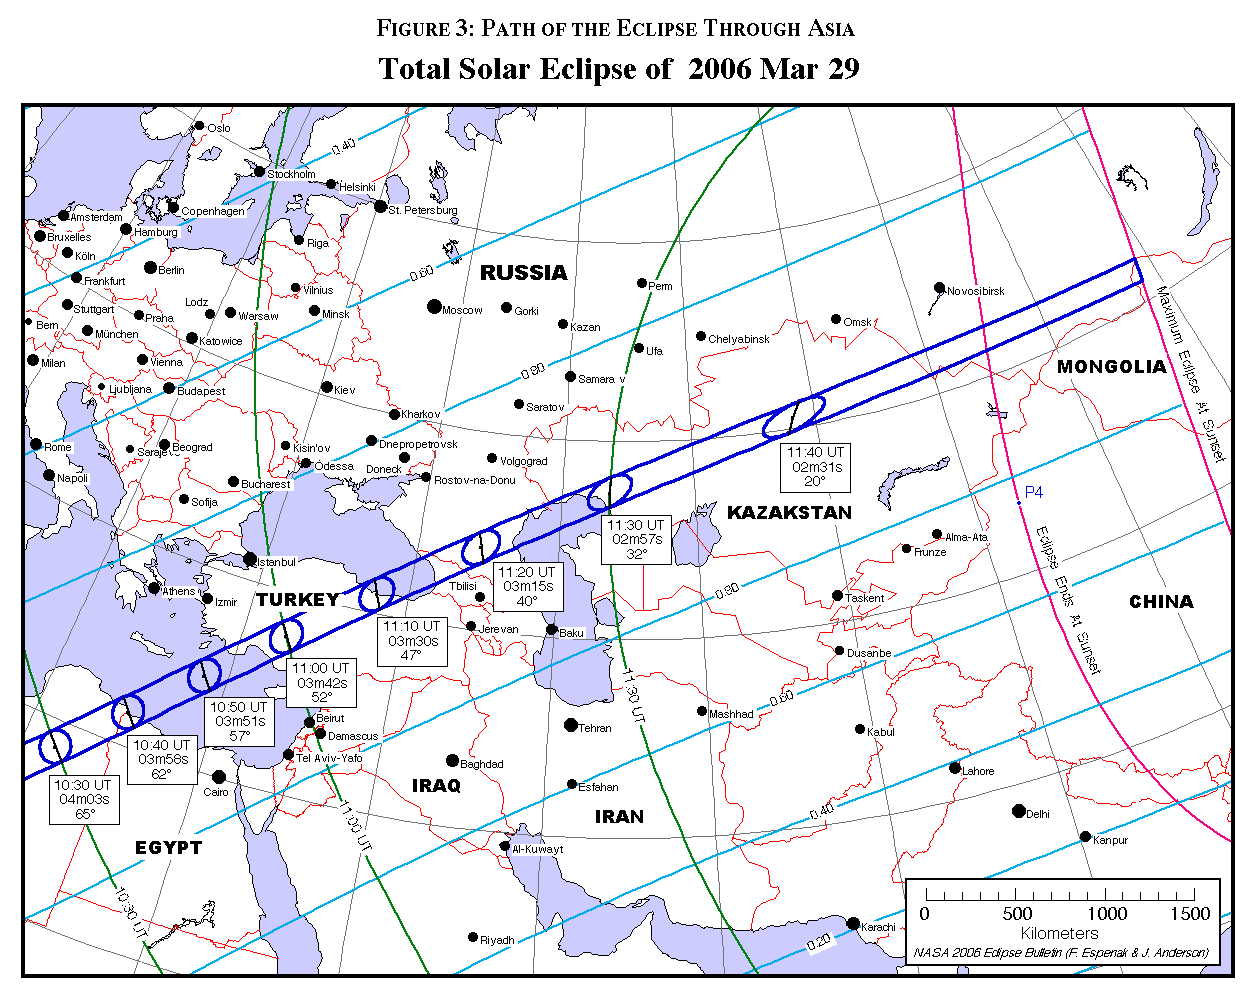
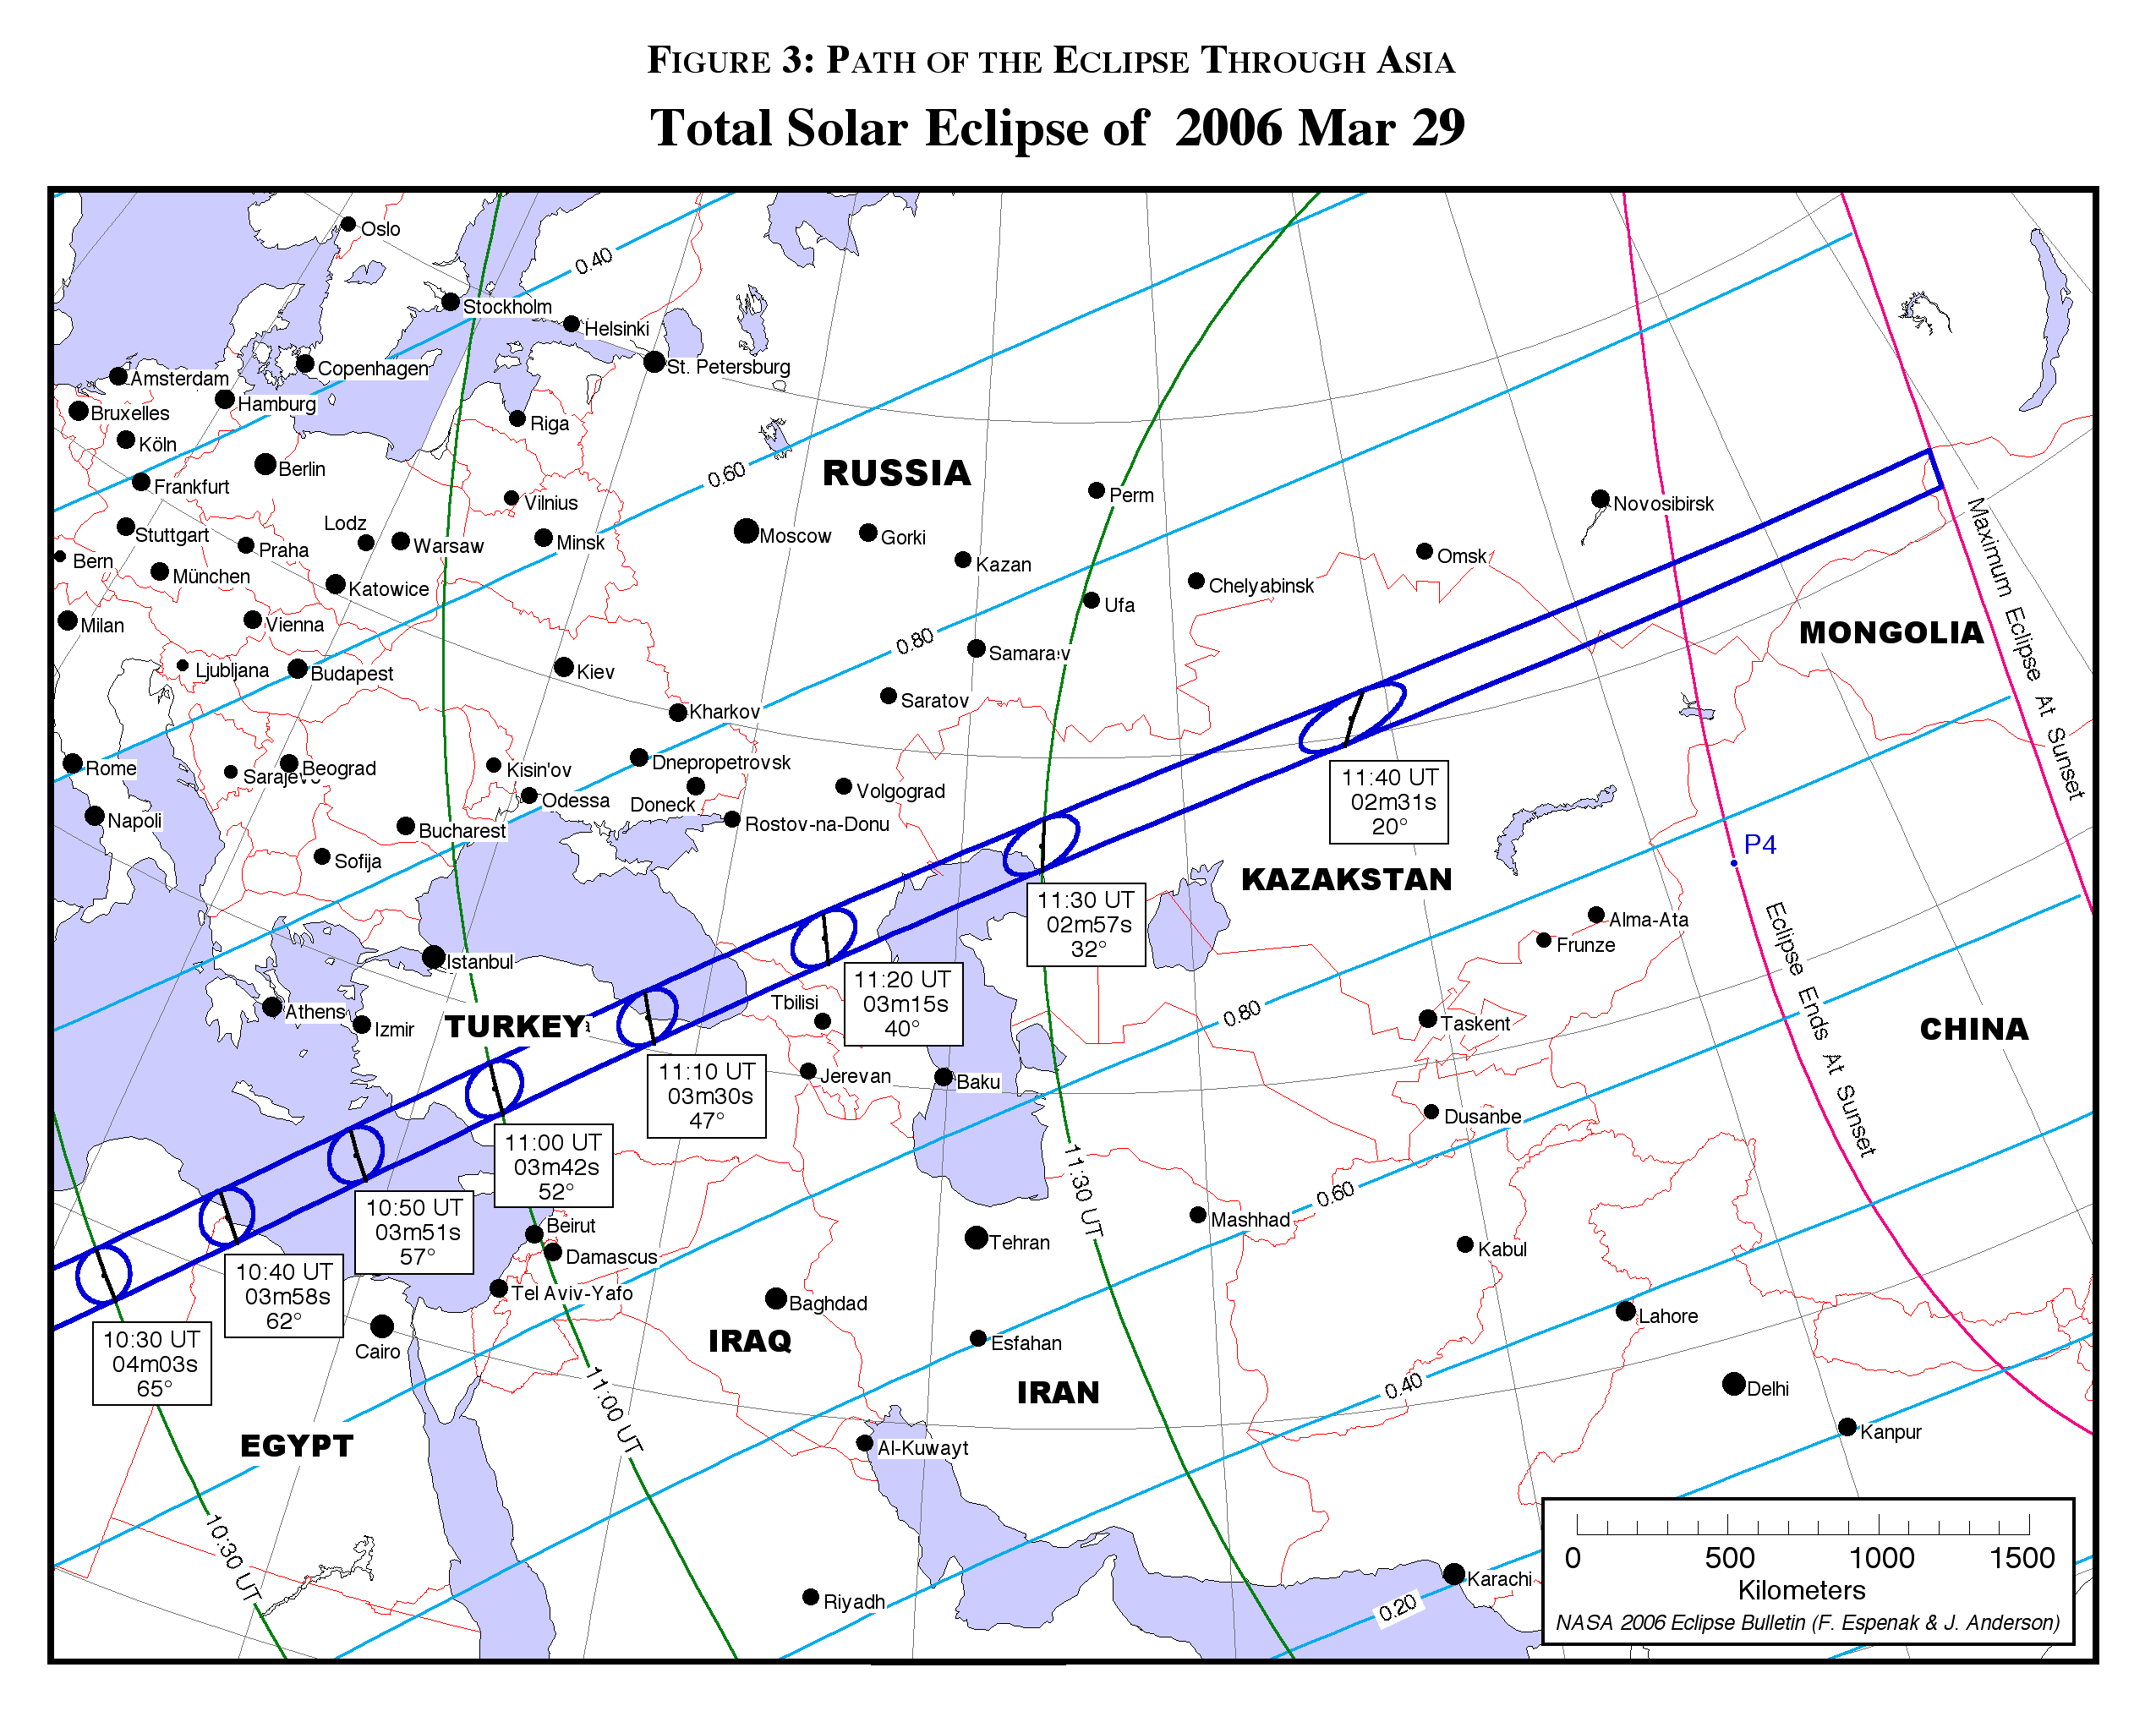
The following maps show the overall regions of visibility of the partial eclipse as well as the path of the total eclipse through Africa and Asia. They use high resolution coastline data from the World Data Base II (WDB). Each map was chosen to isolate a specific region along the land portion of the eclipse path. Curves of maximum eclipse are included as well as the outline of the umbral shadow.
Each map is available in two resolutions: 'Low' (web resolution) and 'High' (300 dpi print resolution). You may need to set your printer to 25% reduction in order to print 'High' resolution figures on a single page.
| Figure Number | Title/Description | Low Resolution | High Resolution |
| Figure 1 | Orthographic (Global) Map of 2006 Total Solar Eclipse | Low | High |
| Figure 2 | Map of 2006 Eclipse Path Through Africa | Low | High |
| Figure 3 | Map of 2006 Eclipse Path Through Asia | Low | High |
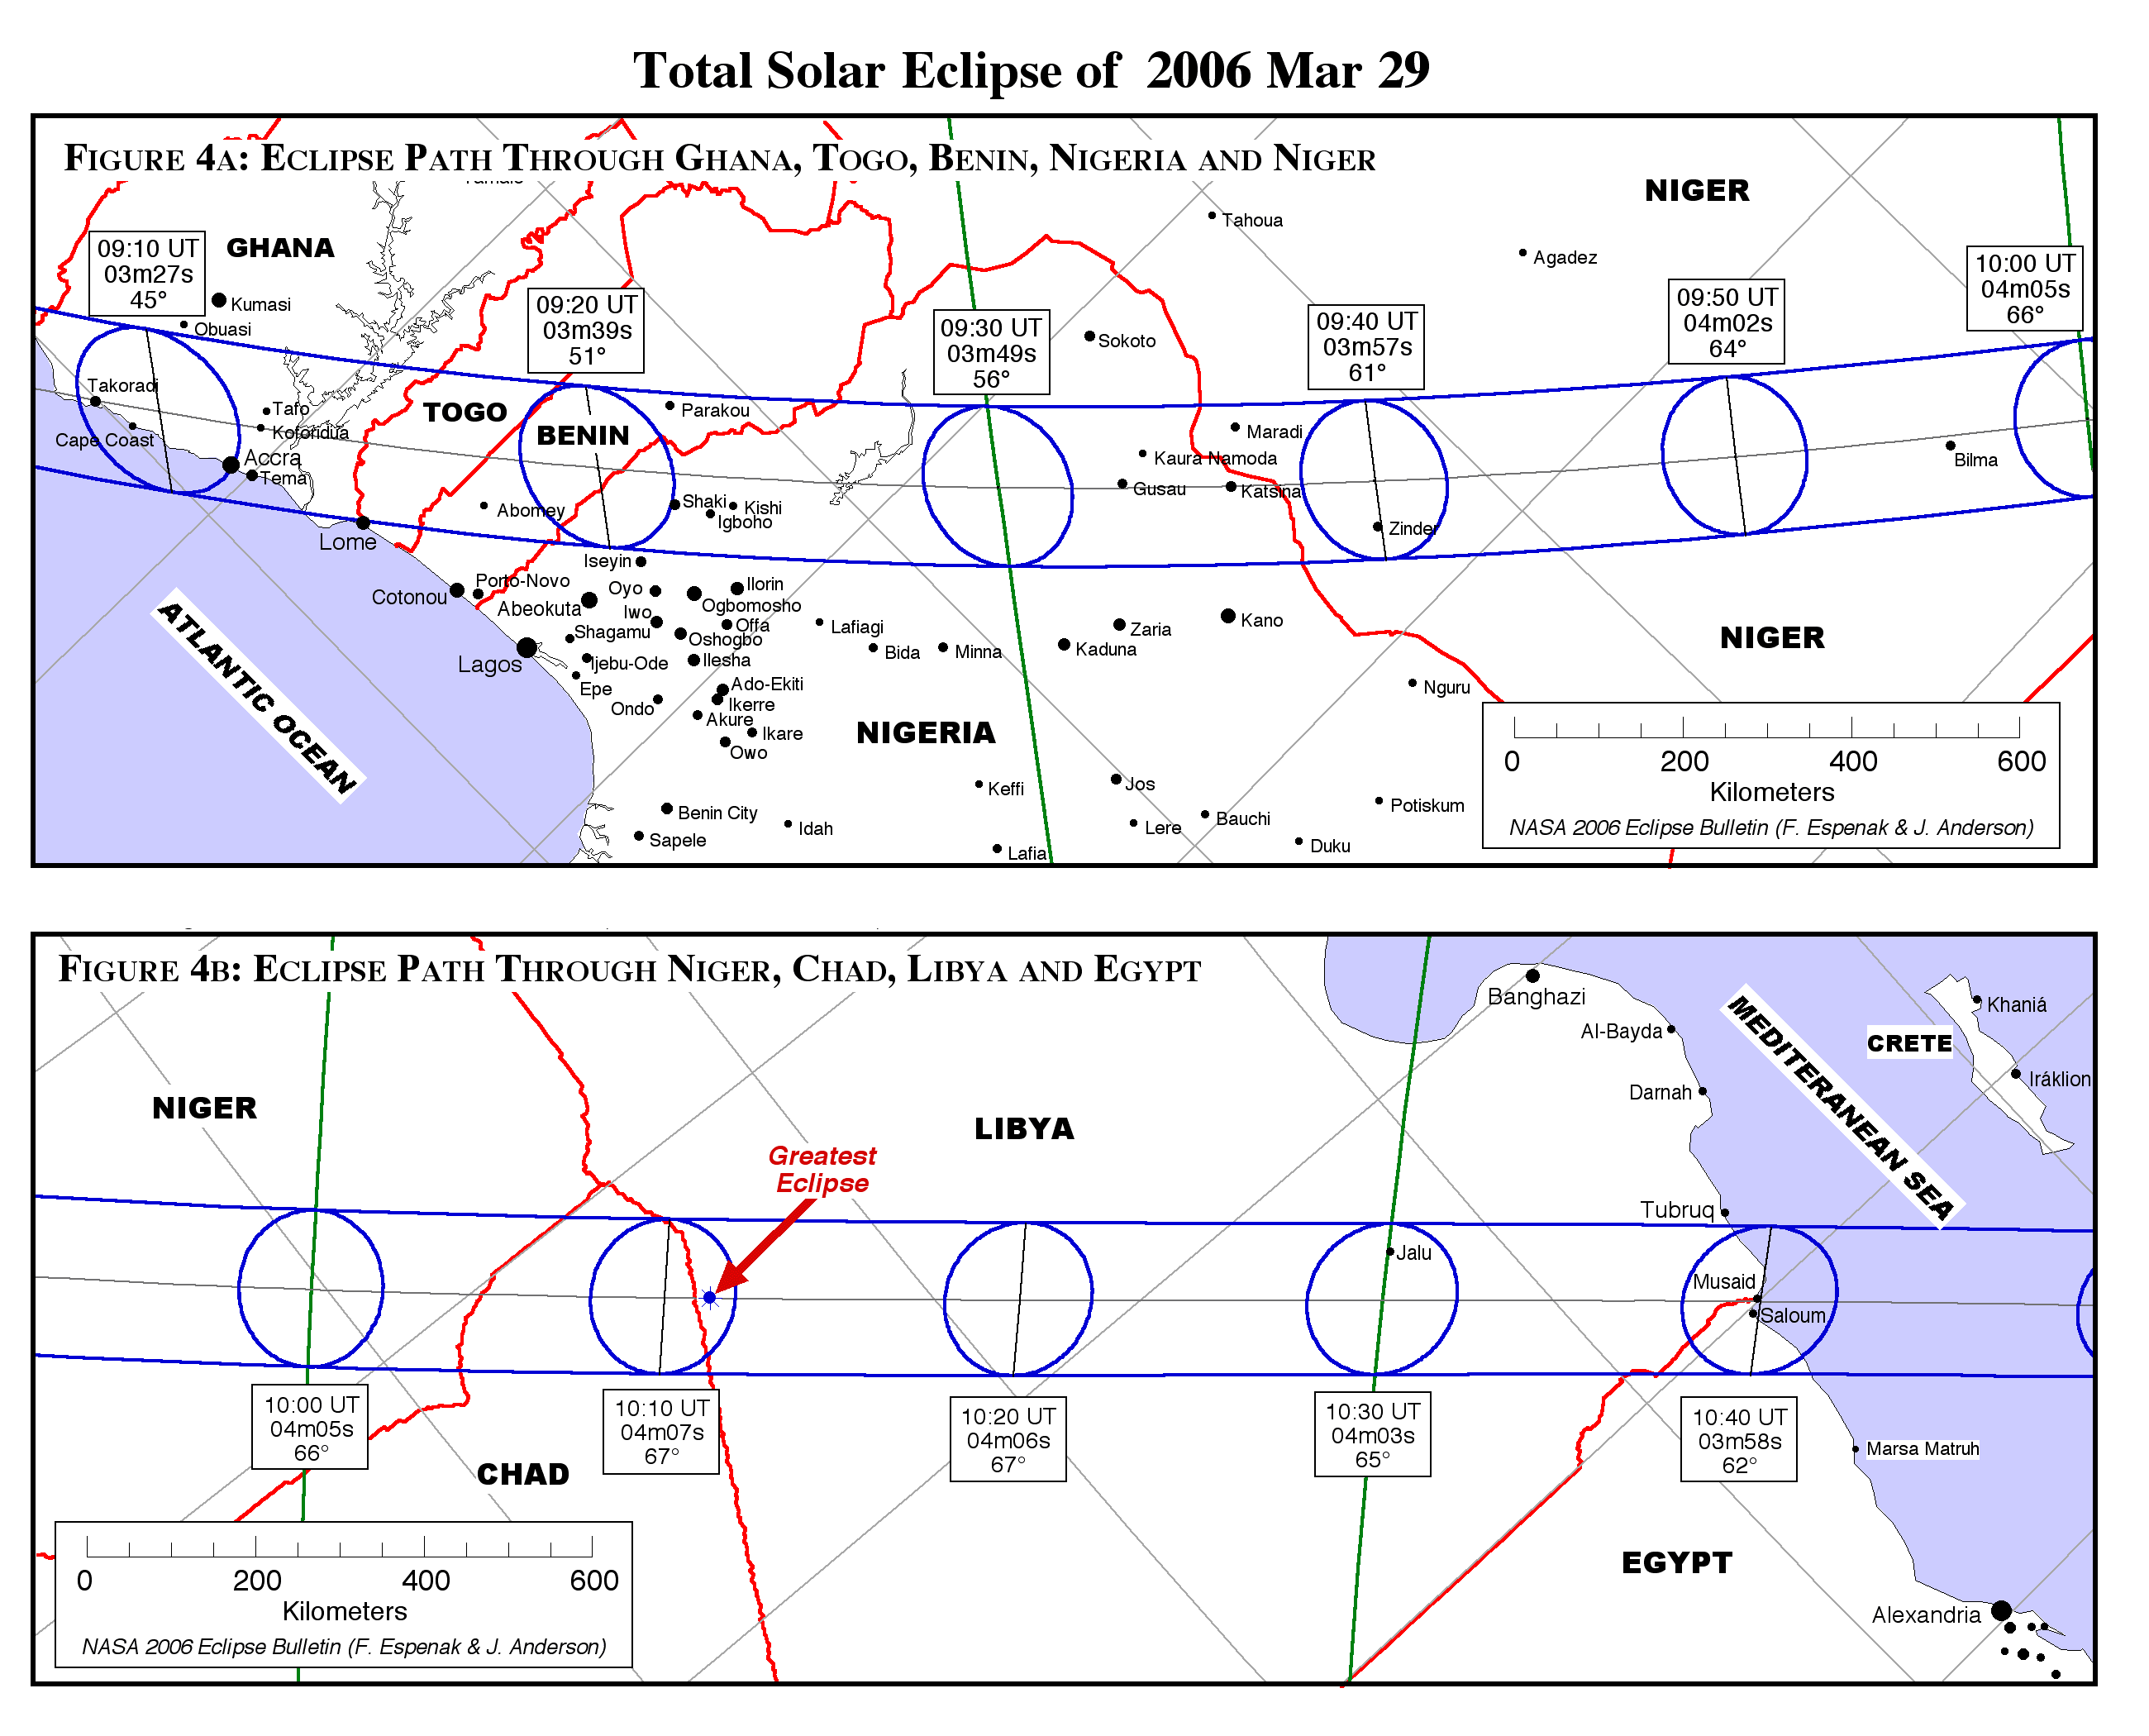
| Figure 4 | Detailed Map of 2006 Eclipse Path Through Africa | Low | High |
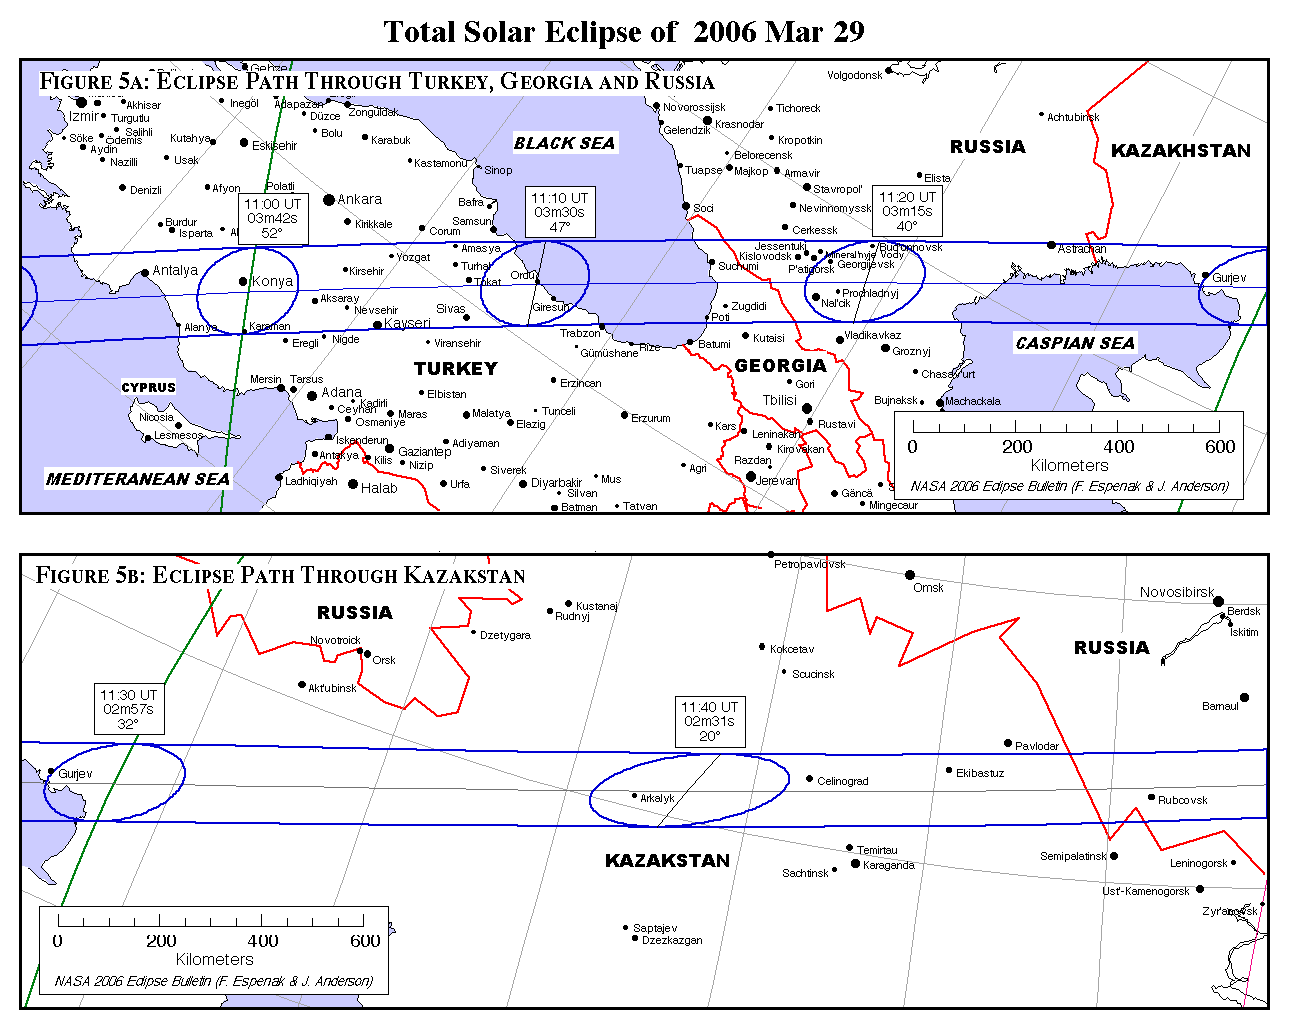
| Figure 5 | Detailed Map of 2006 Eclipse Path Through Asia | Low | High |
Adapted from NASA Tech. Pub. "Total Solar Eclipse of 2006 March 29" (NASA/TP-2004-212762).
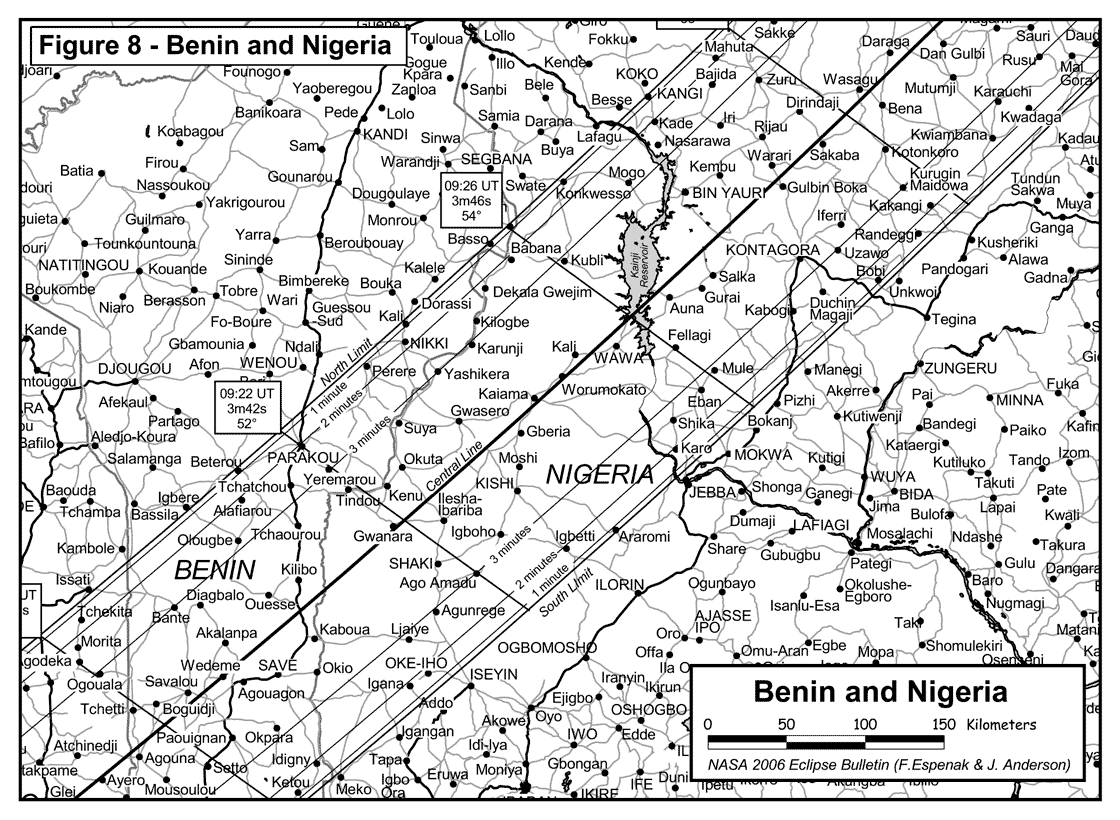
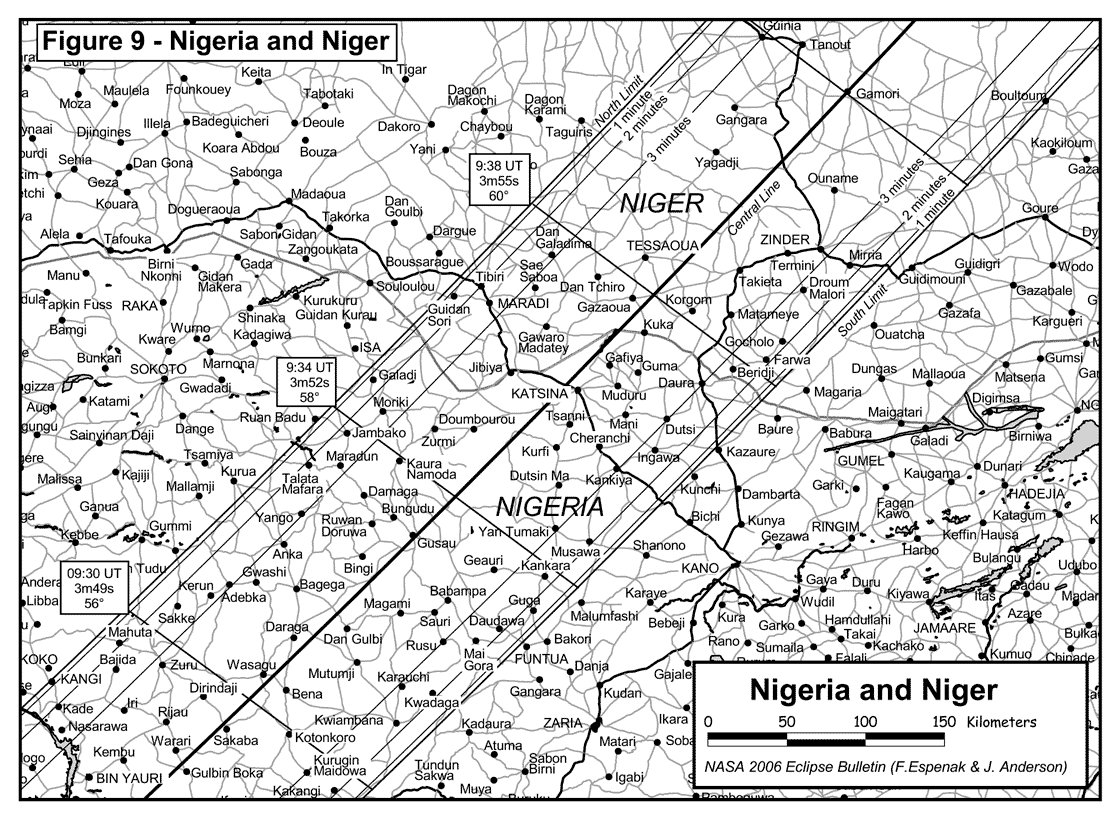
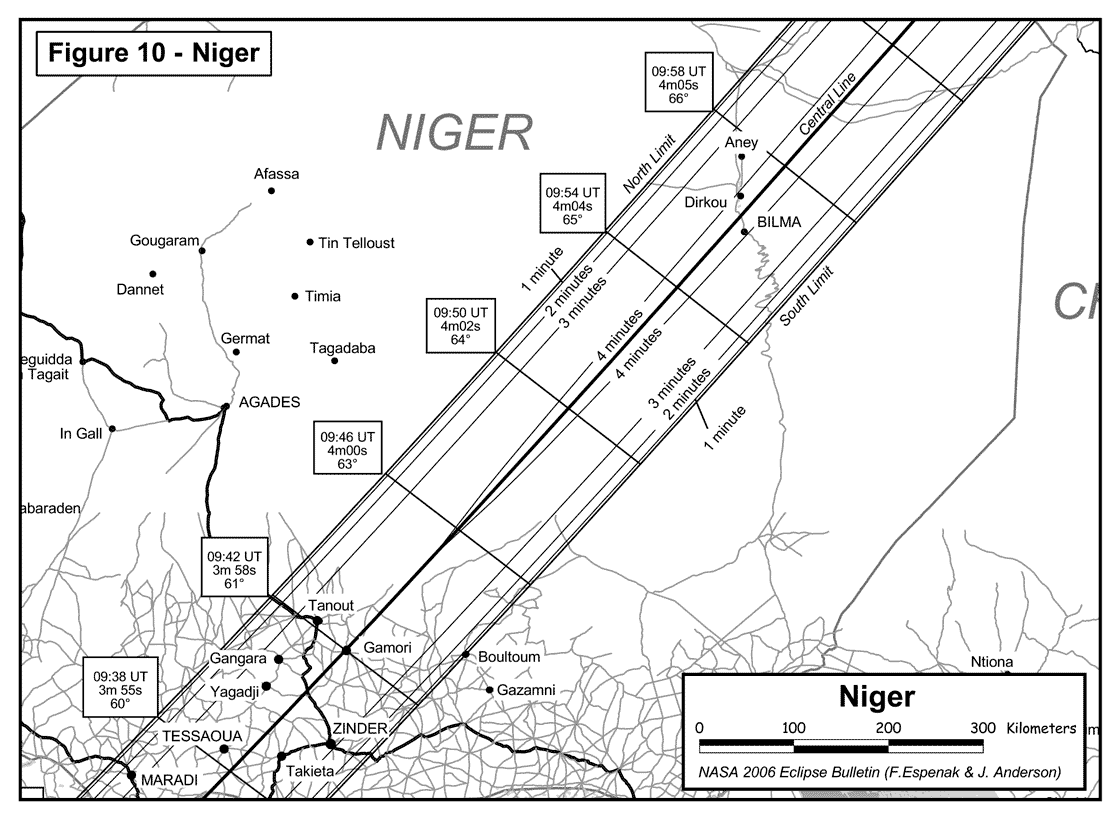
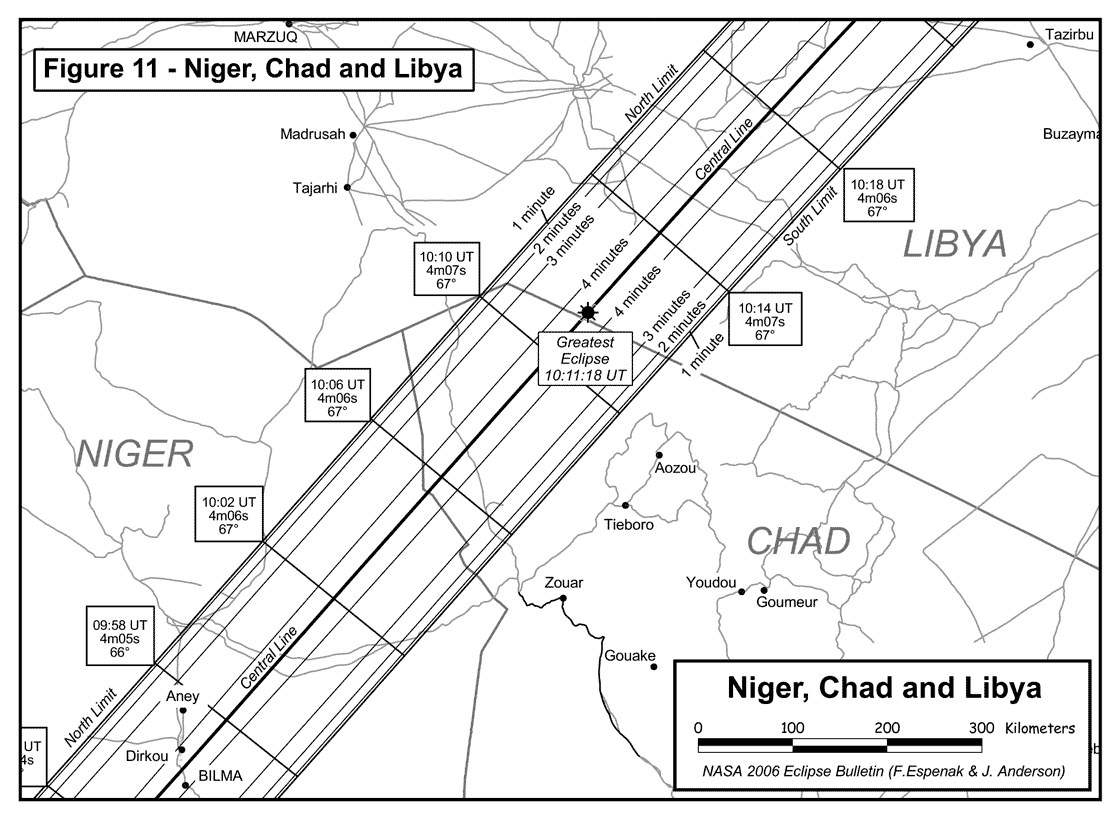
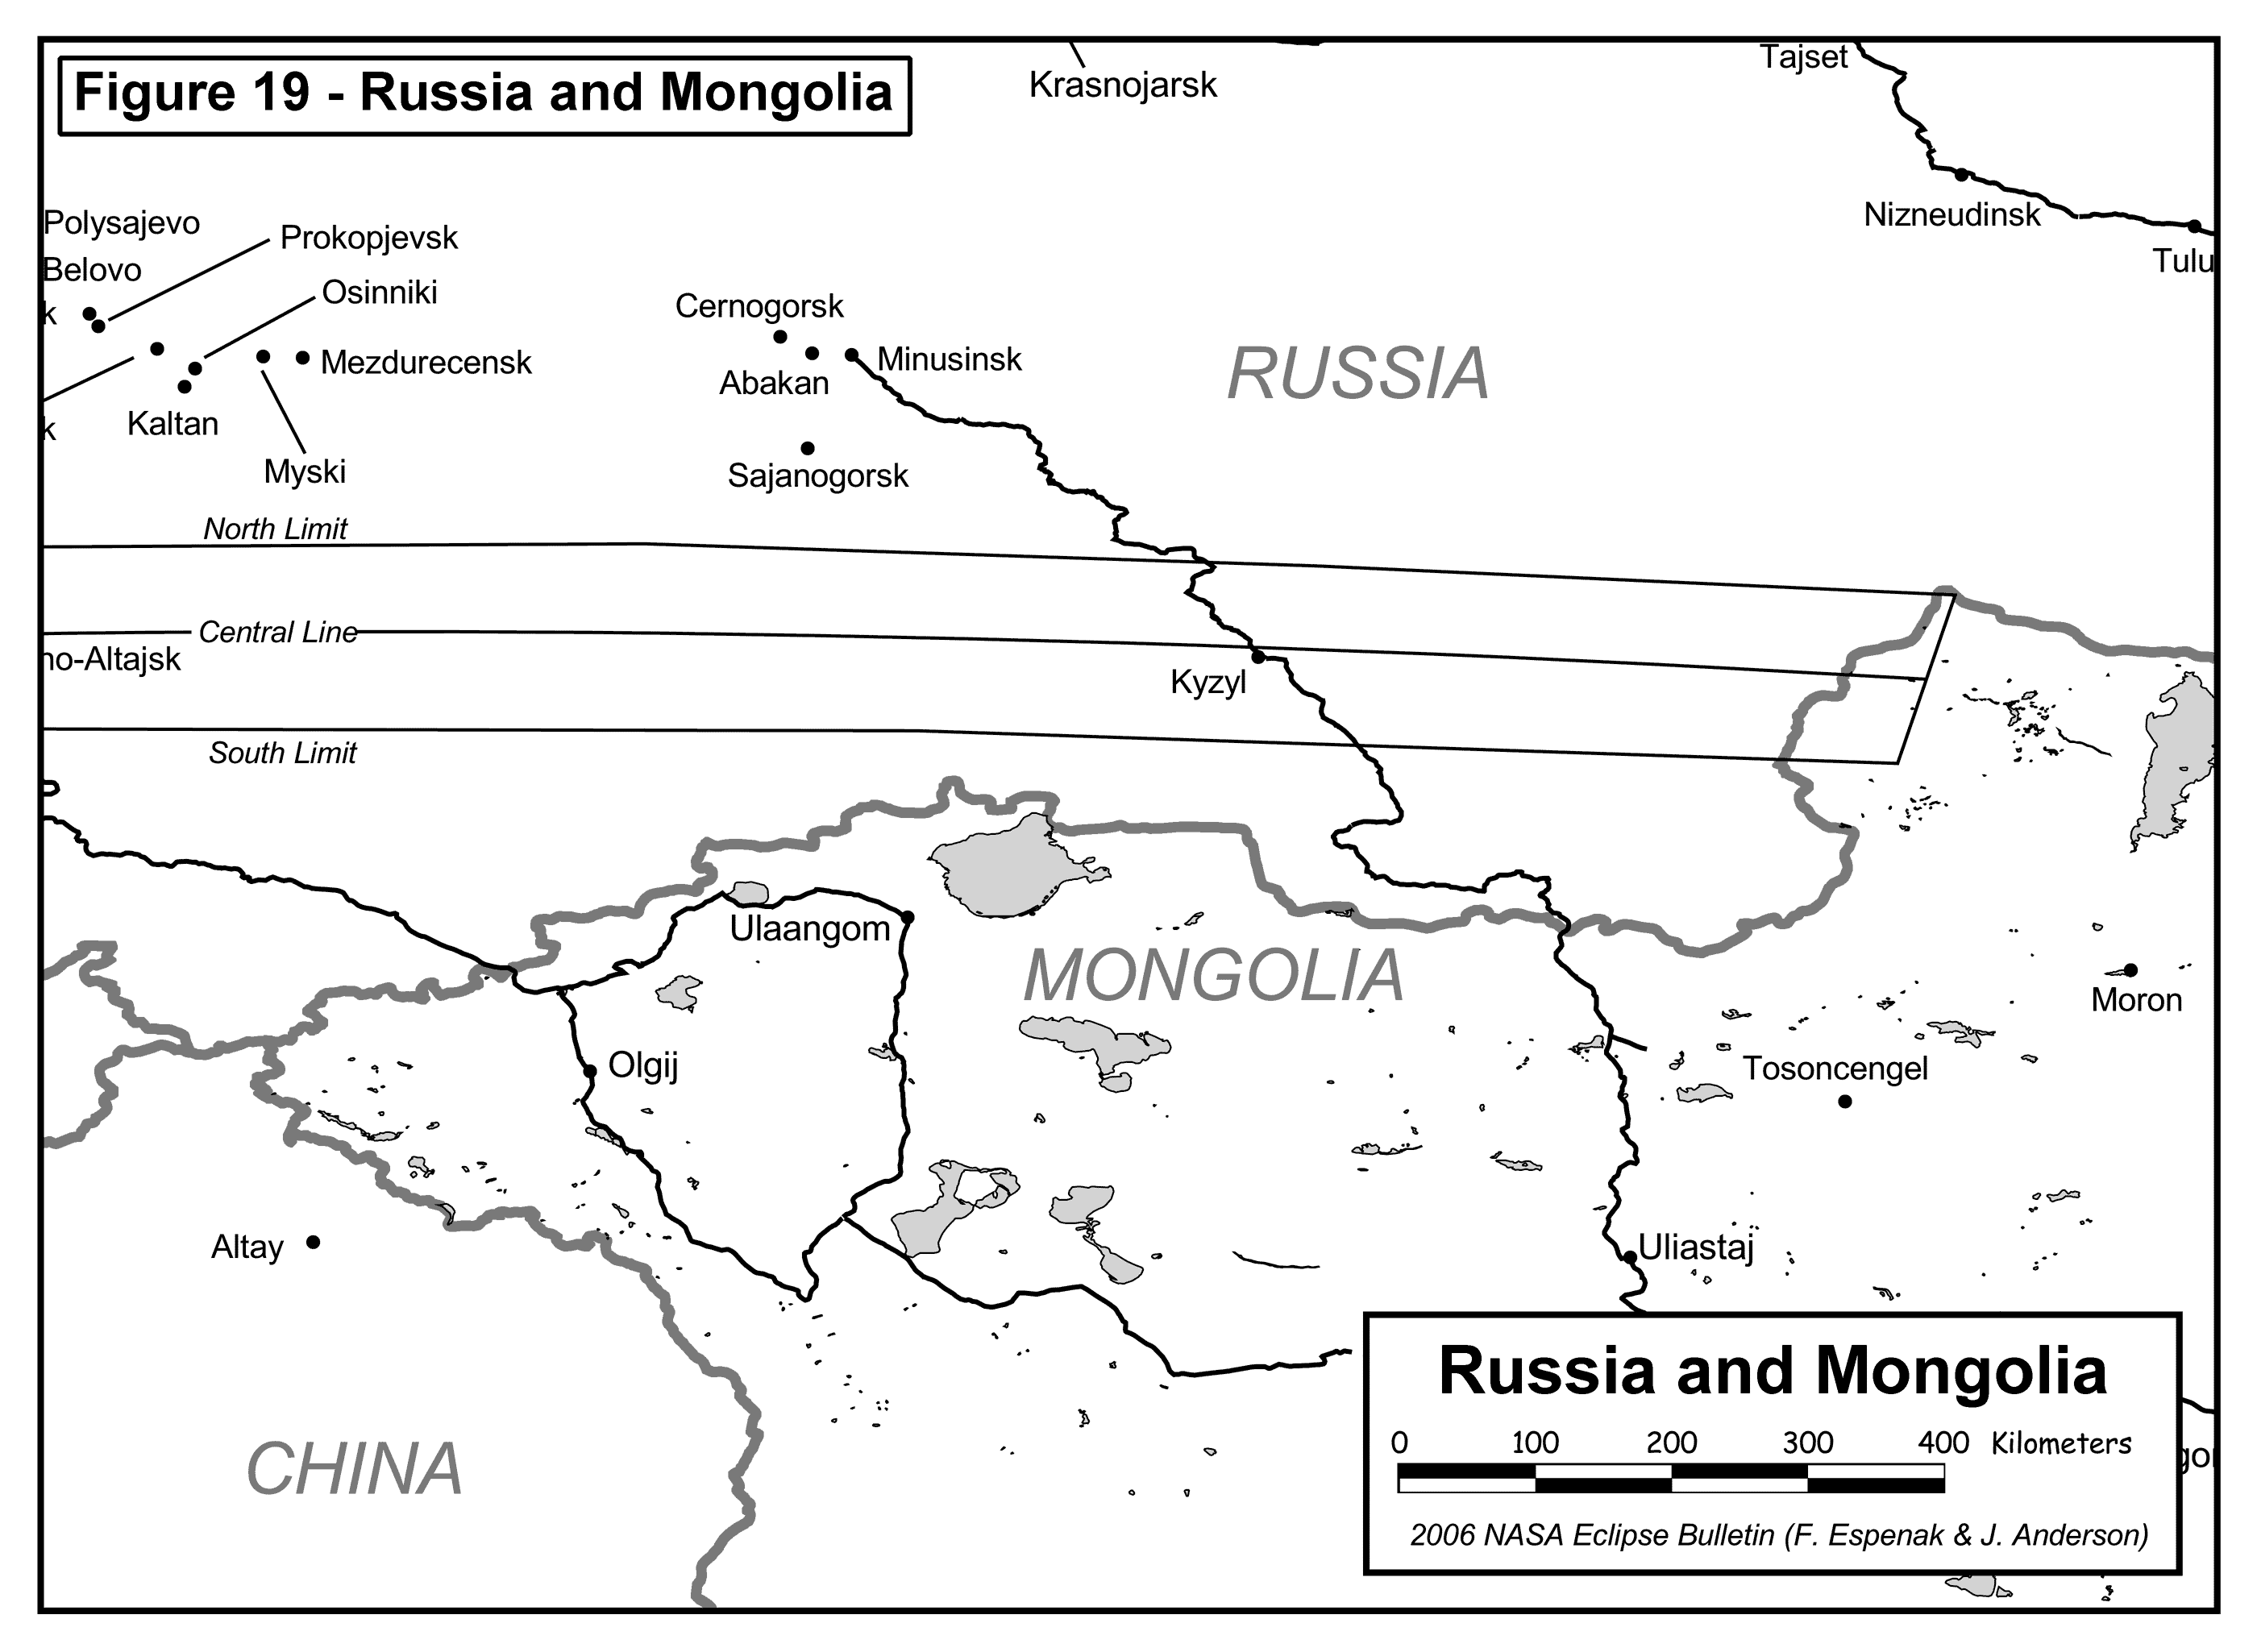
Detailed Maps of the Path of Totality
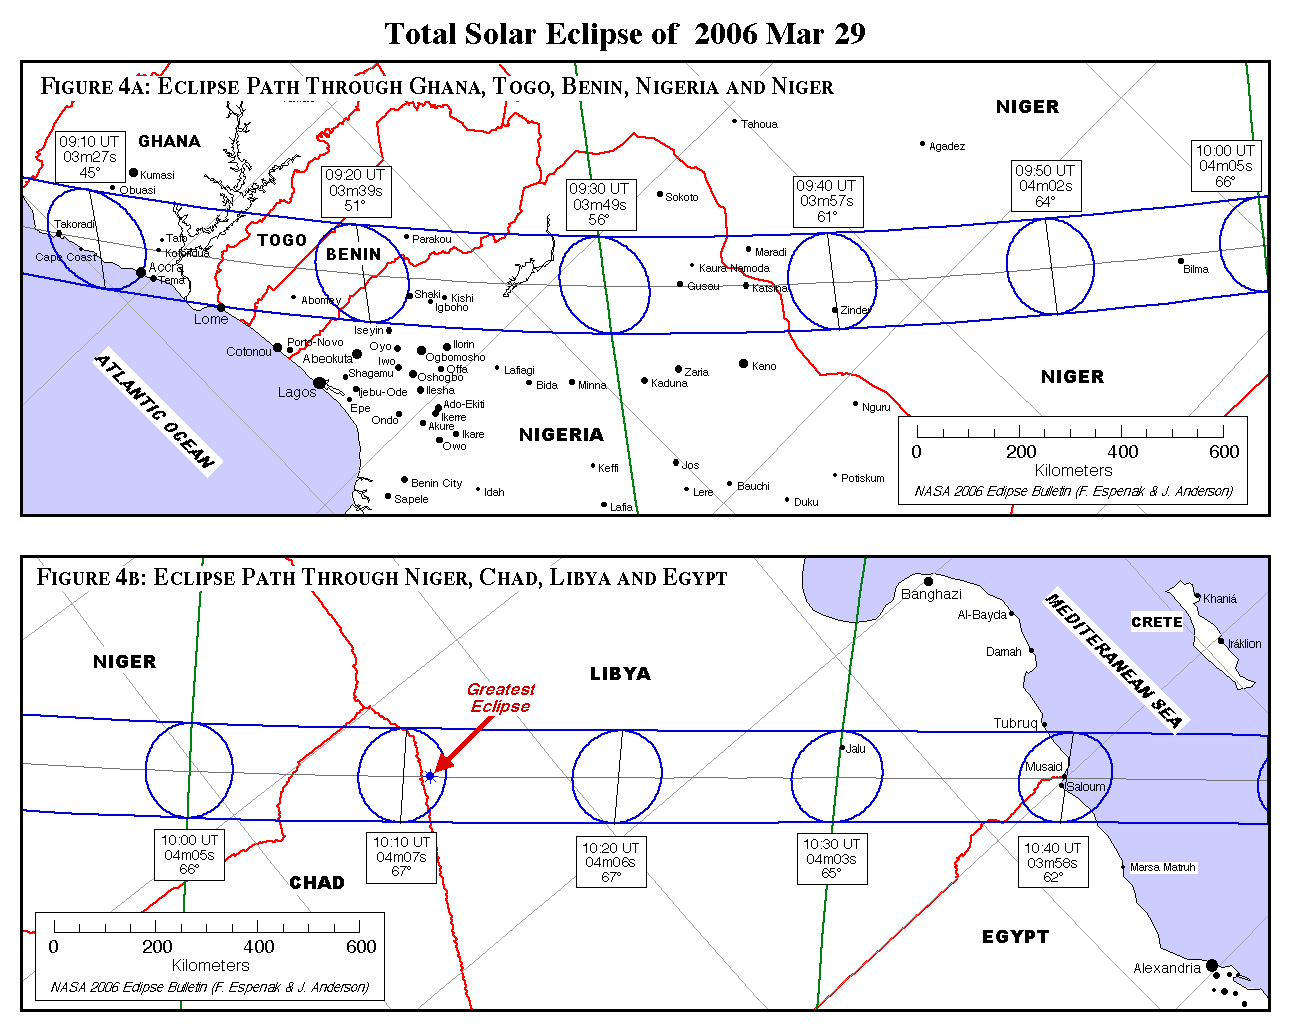
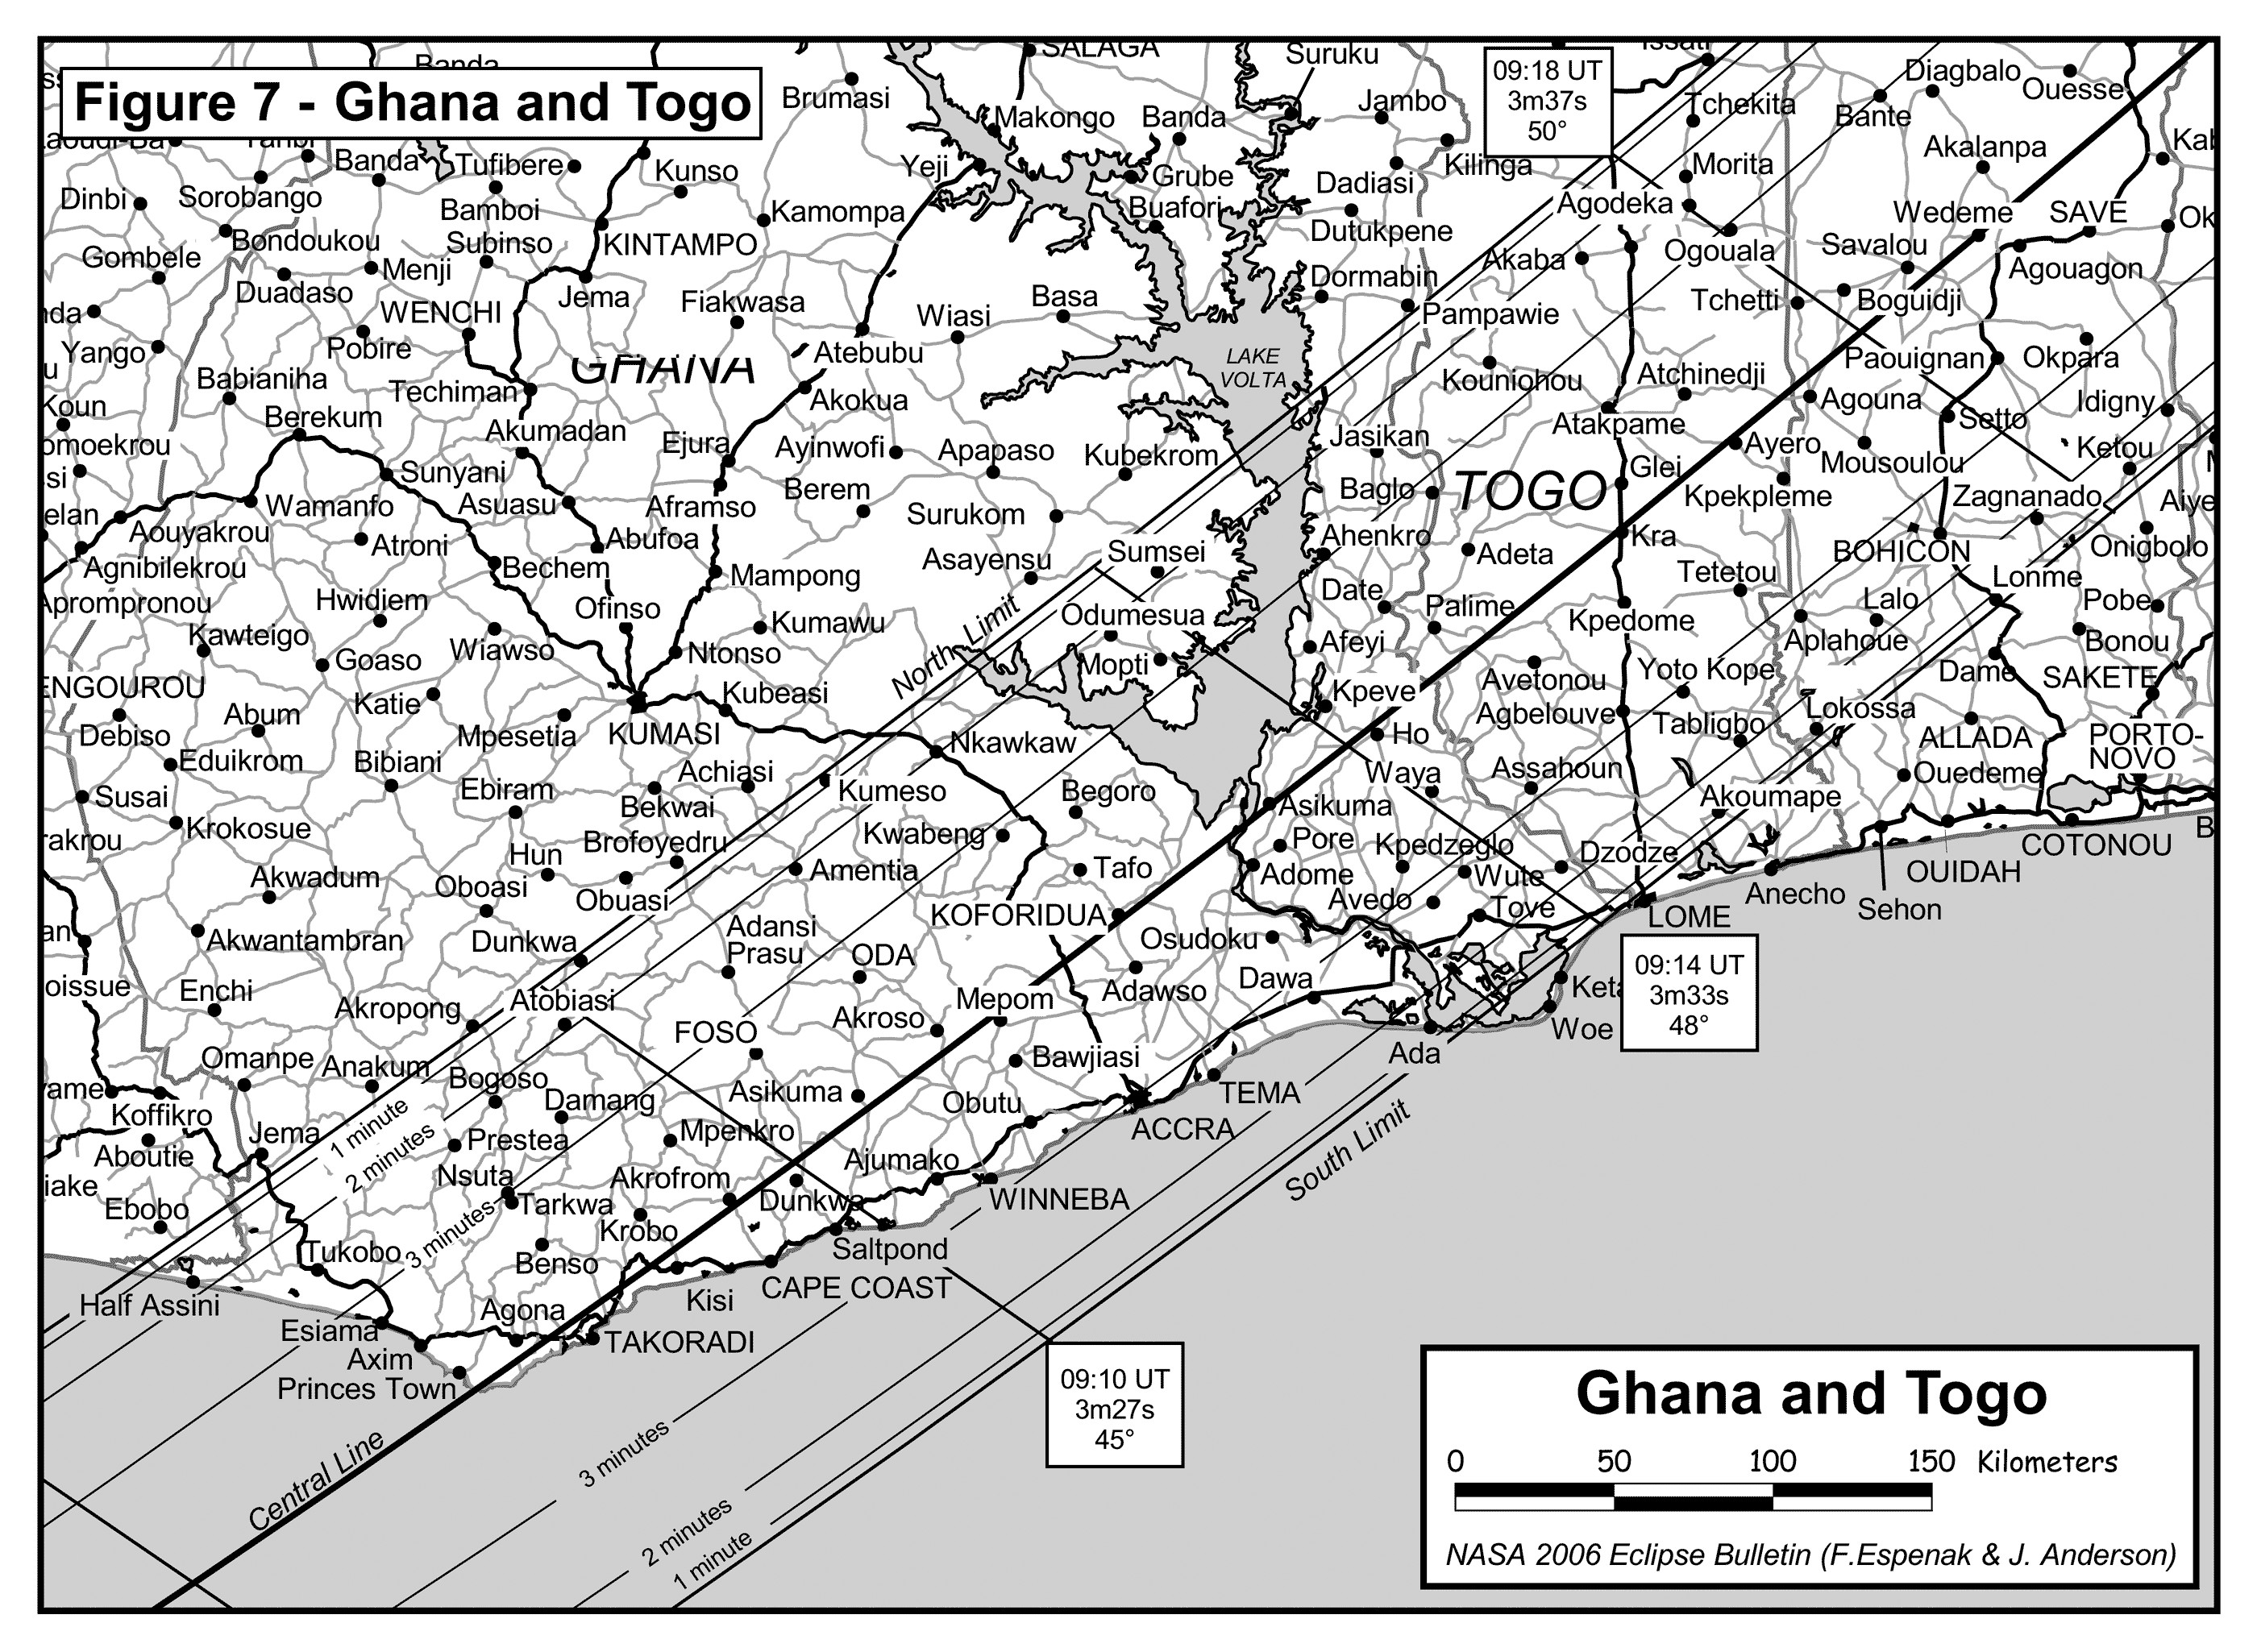
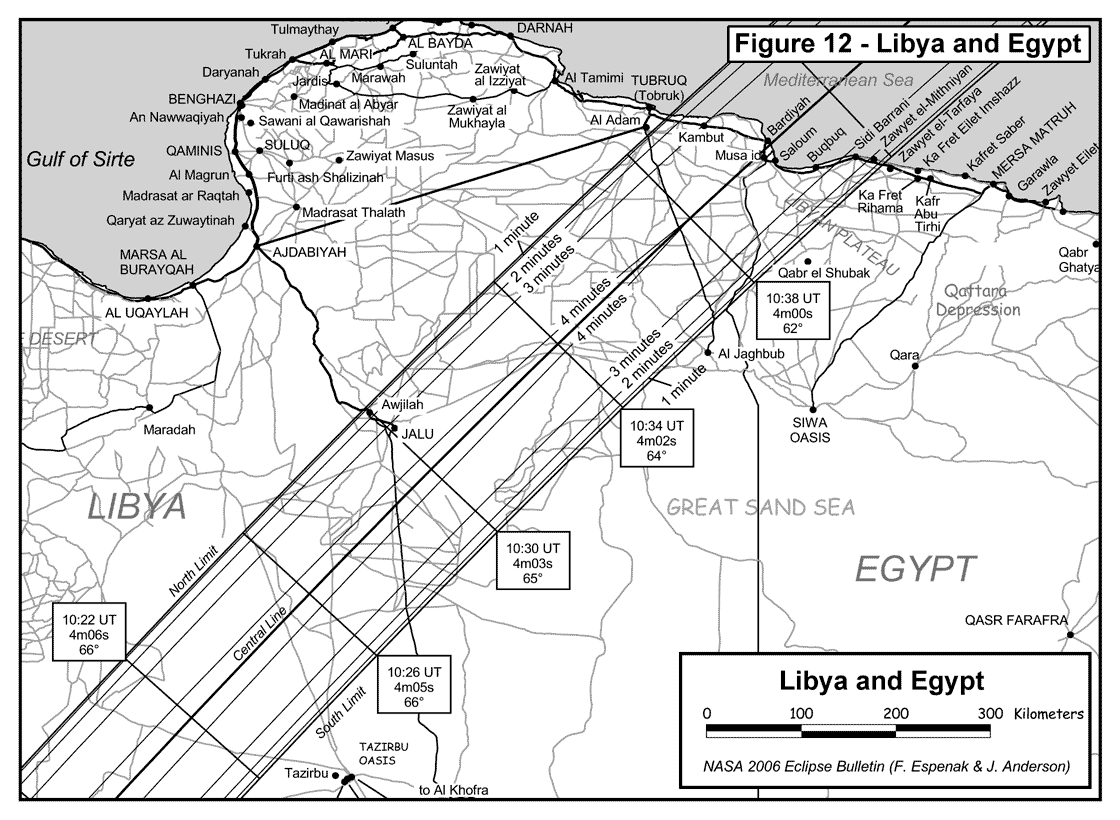
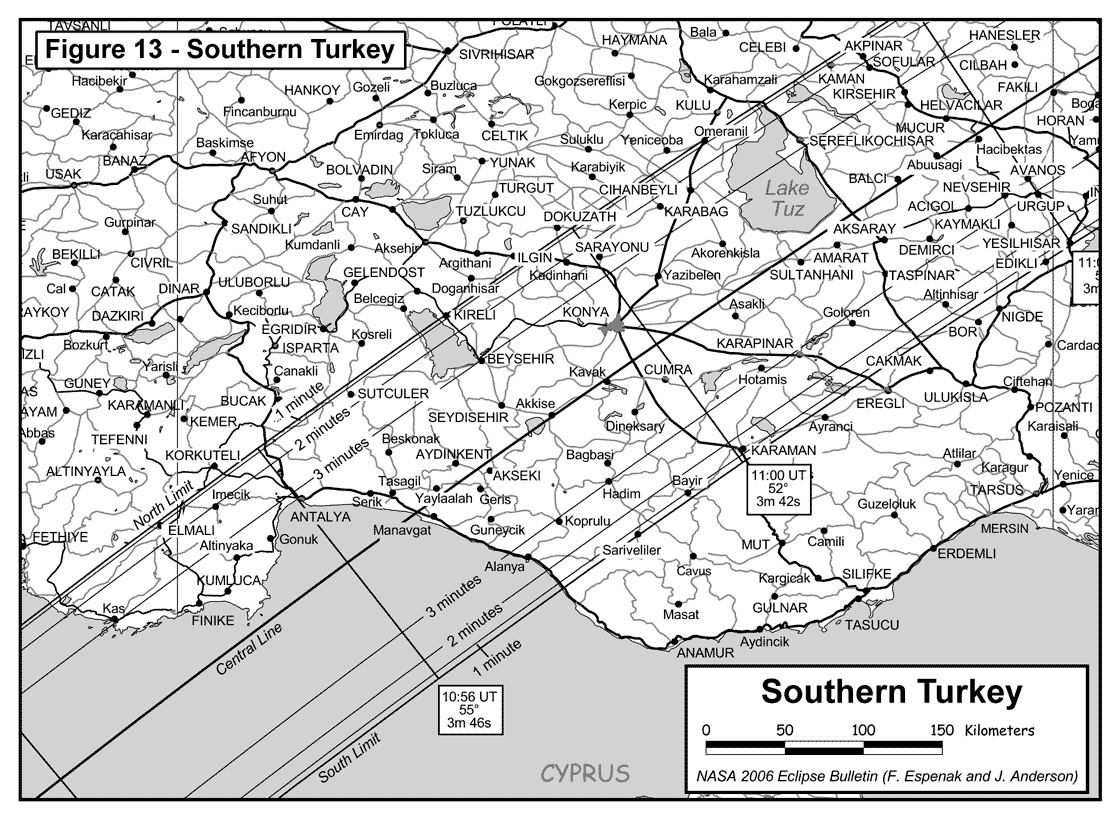
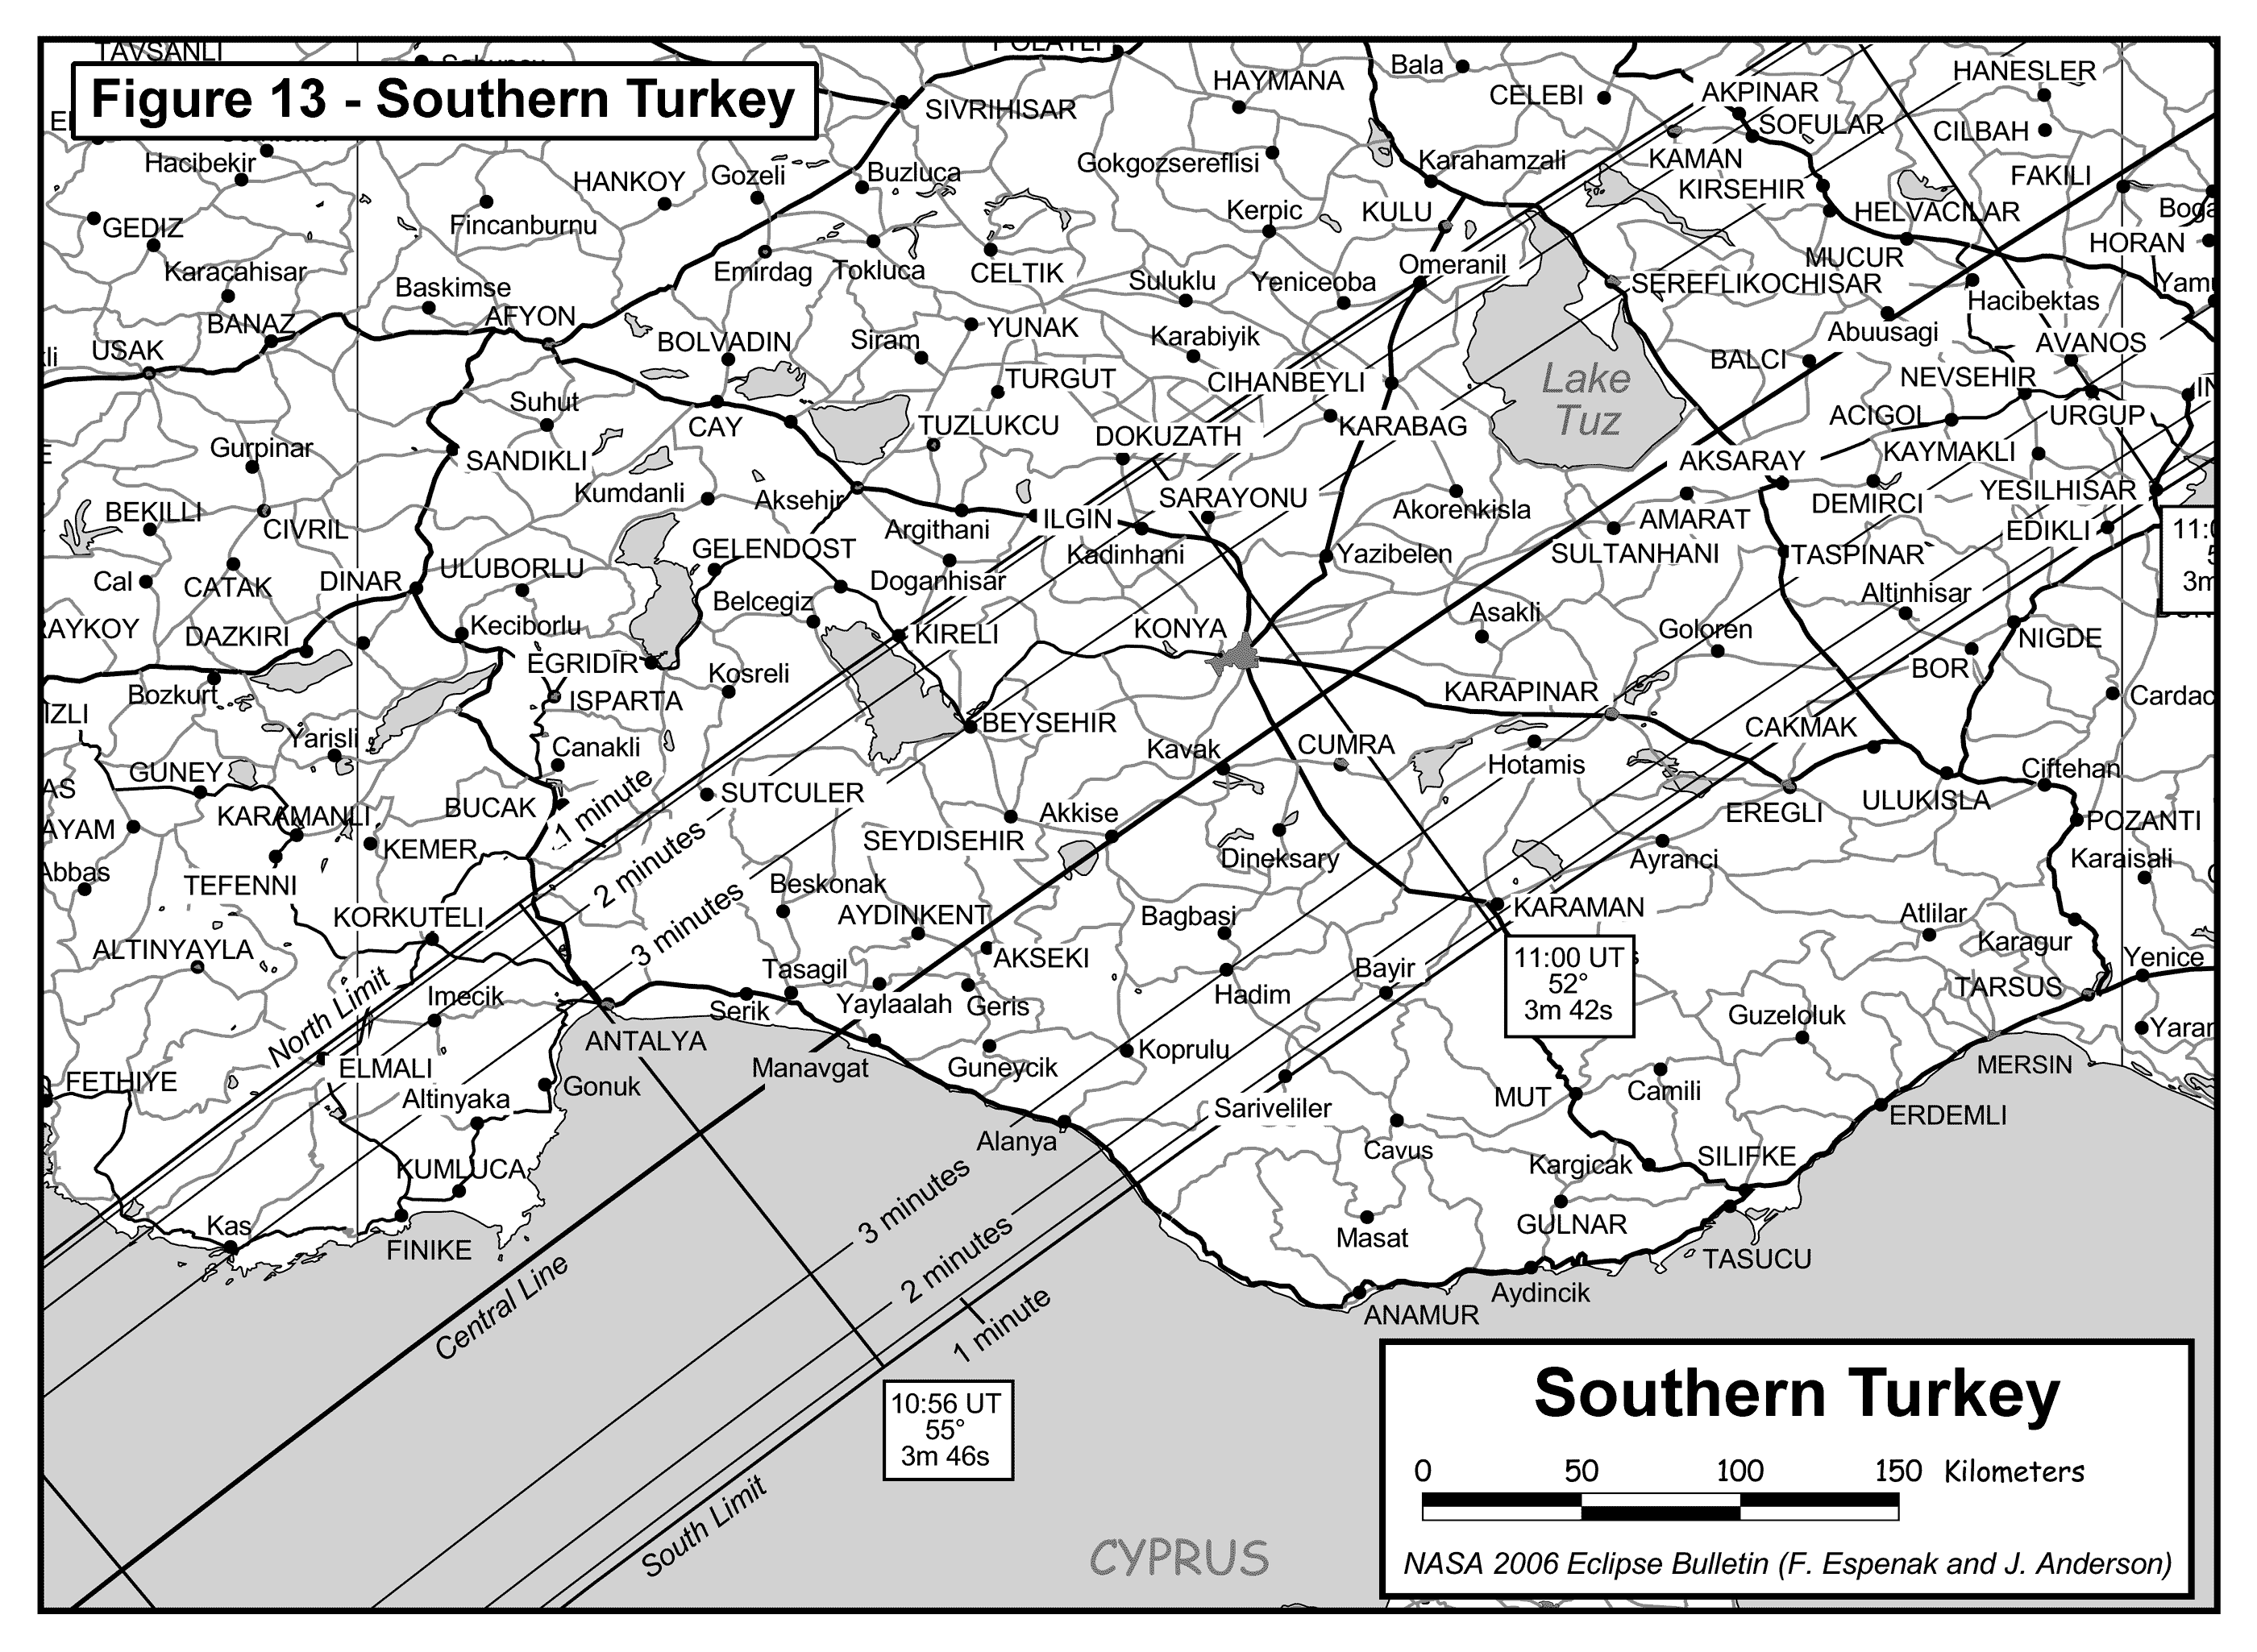
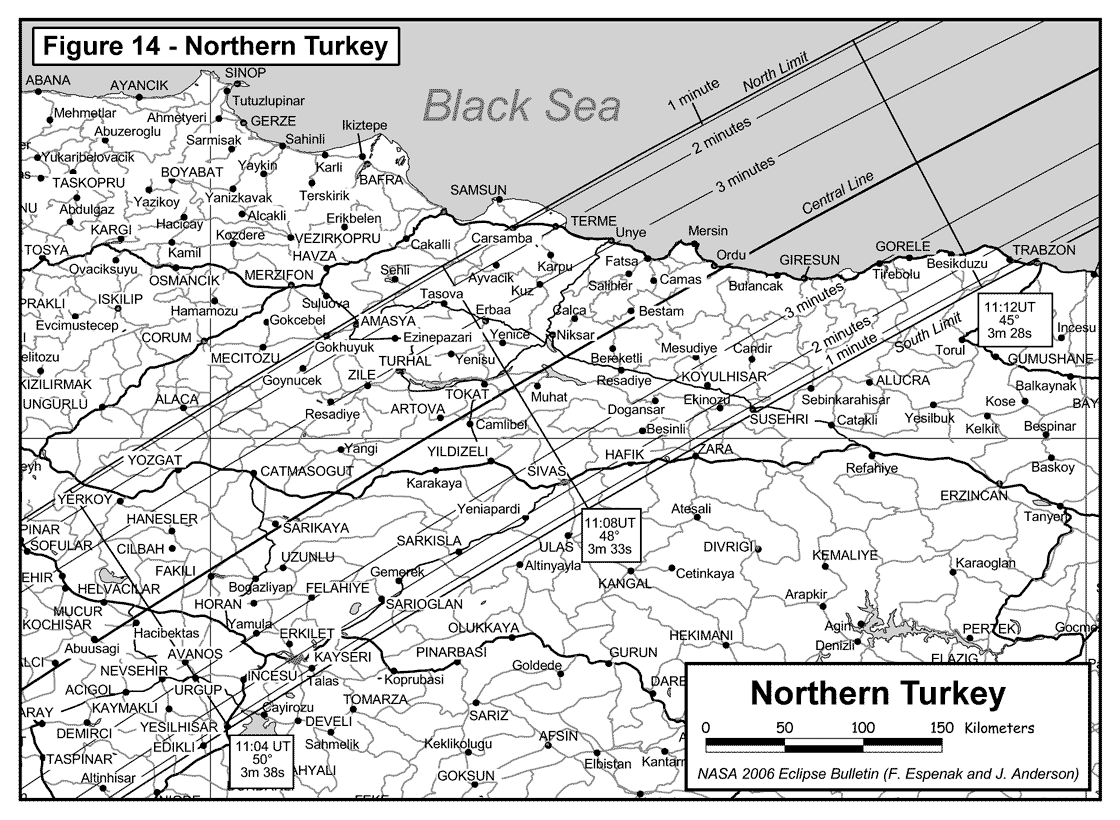
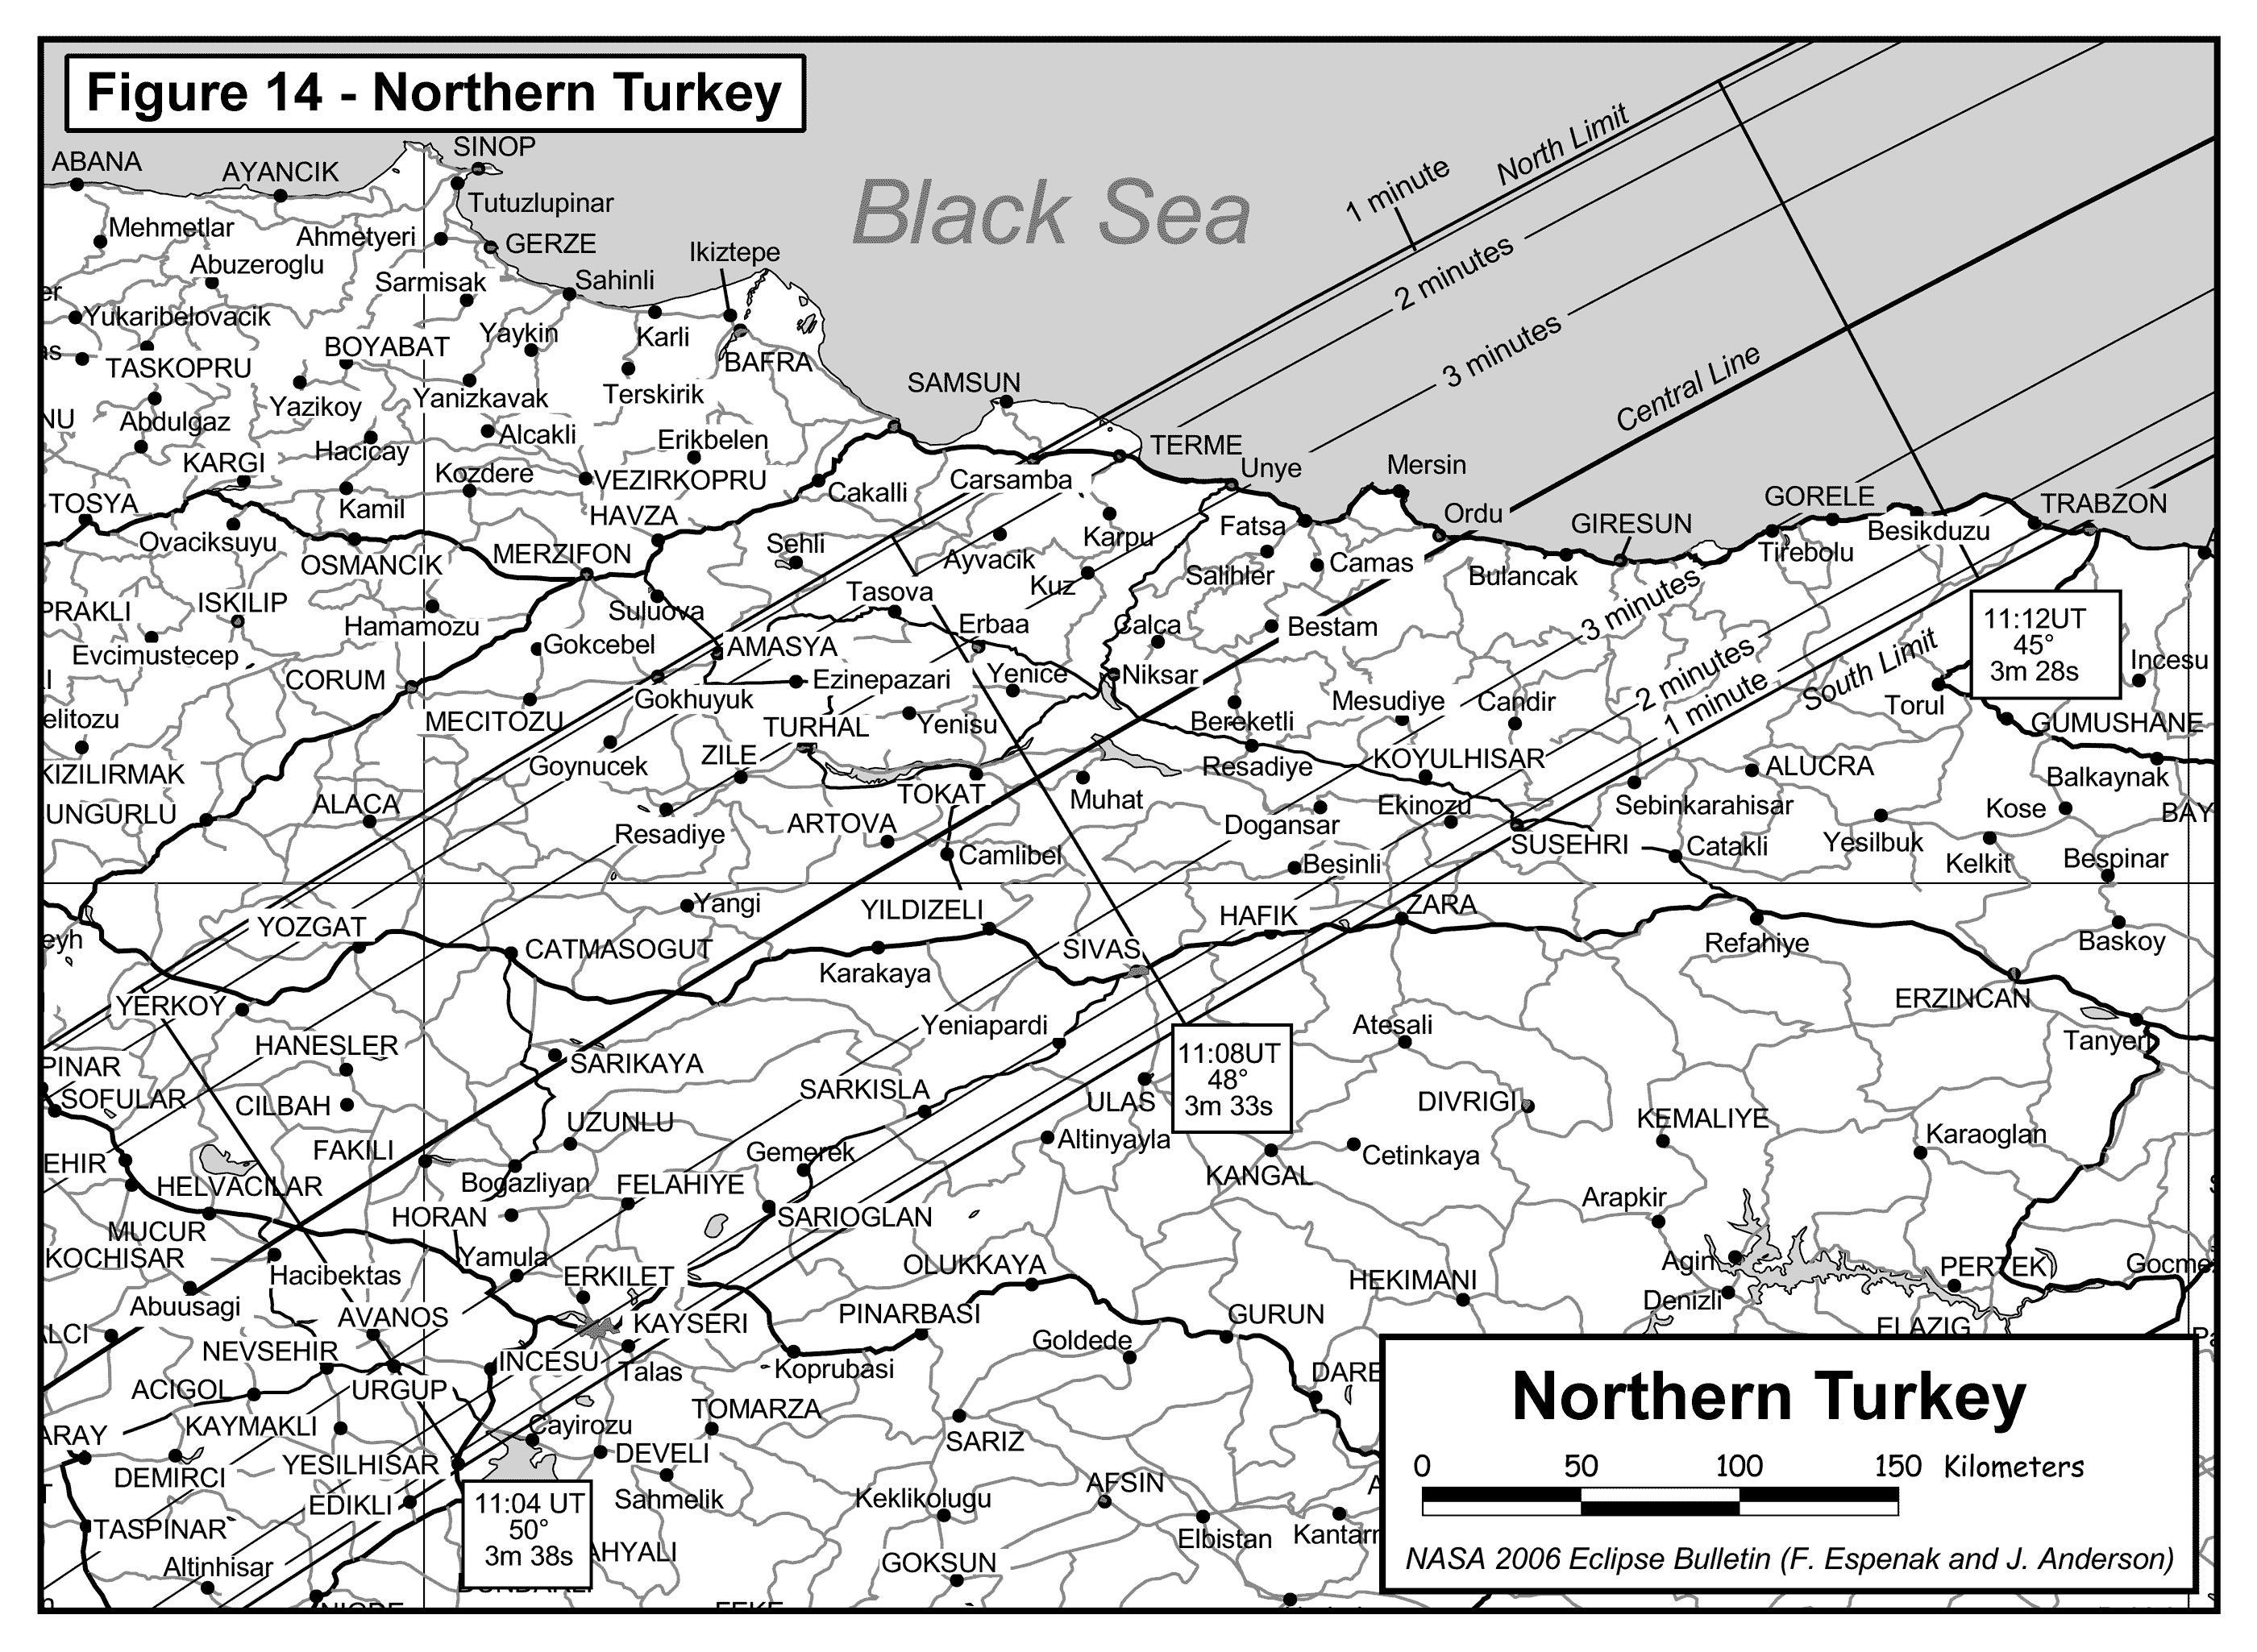
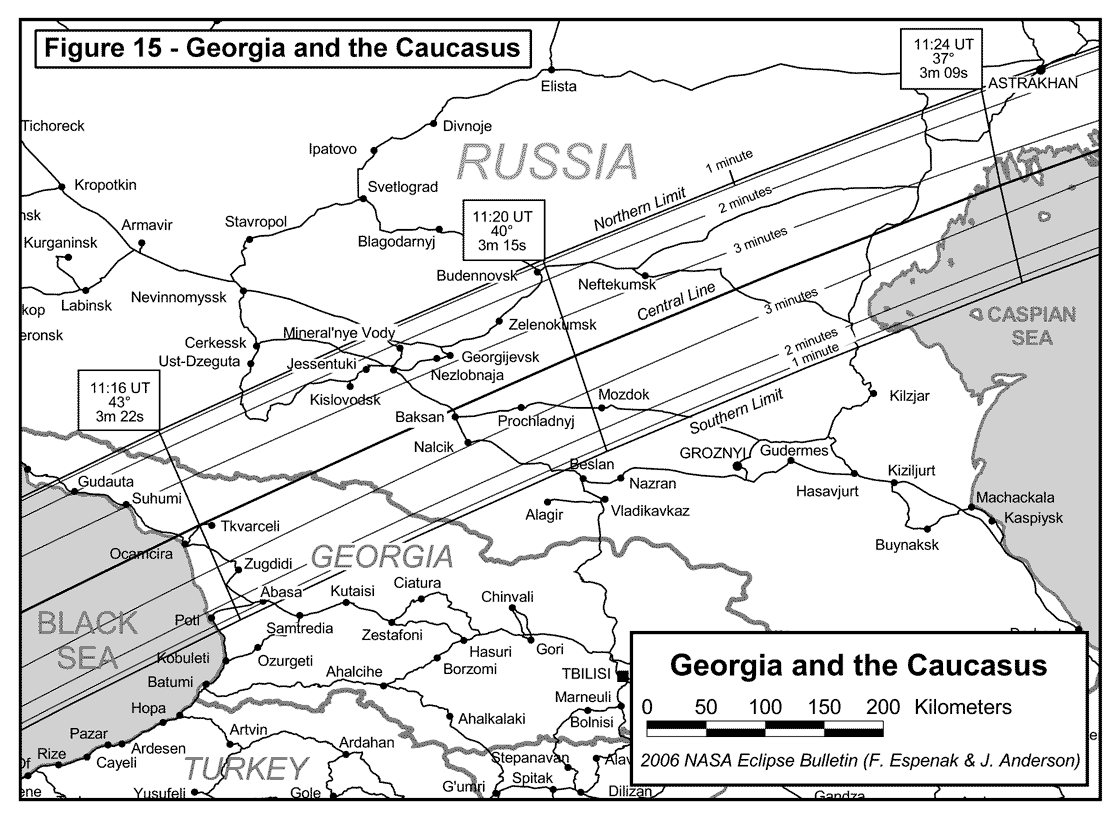
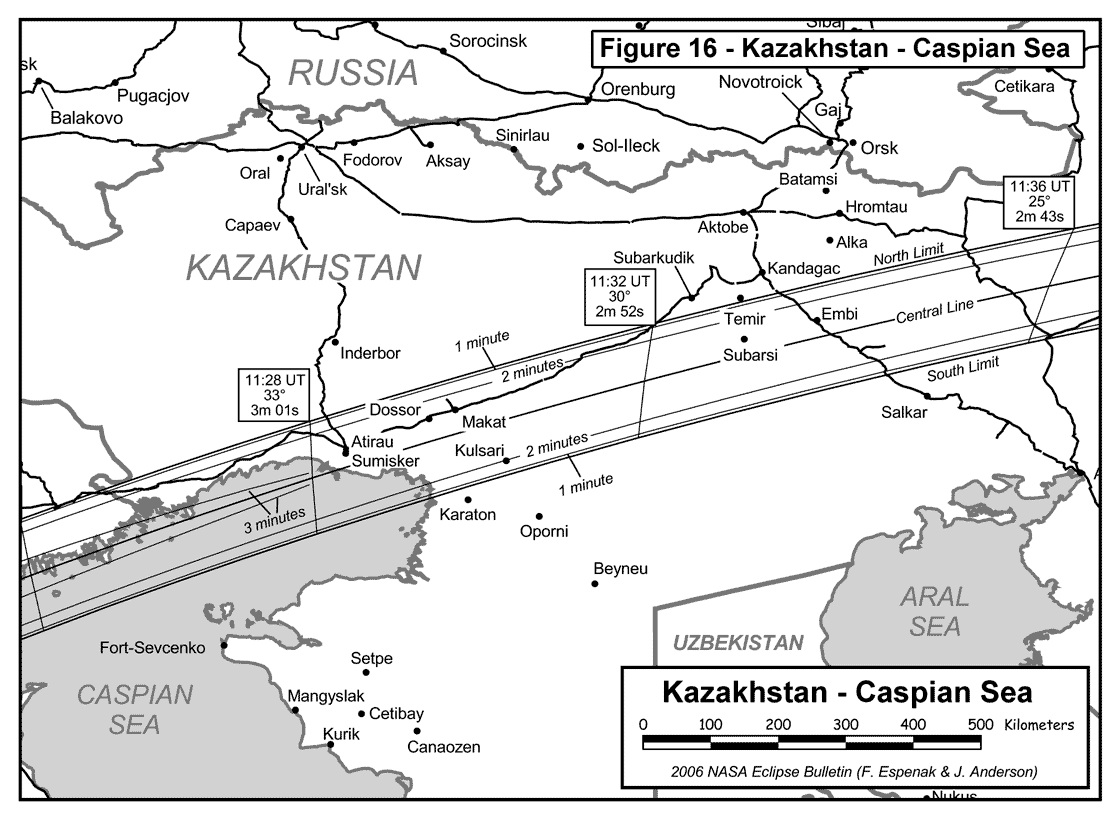
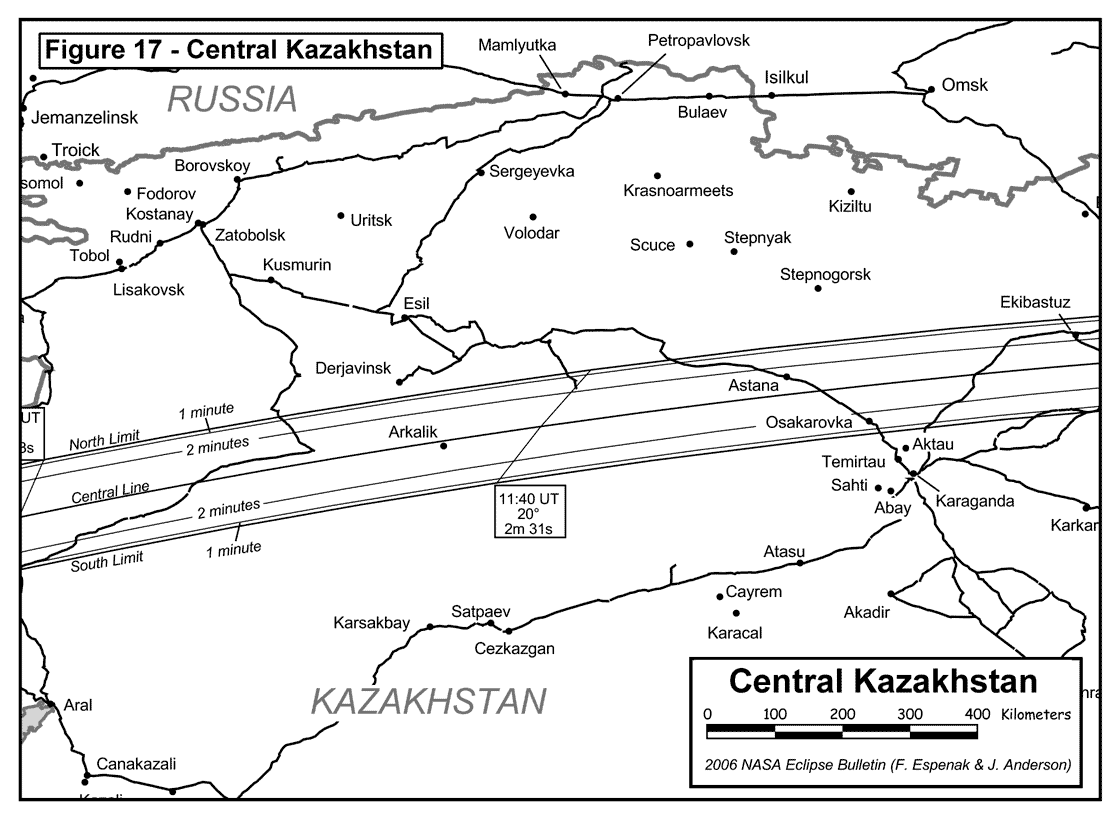
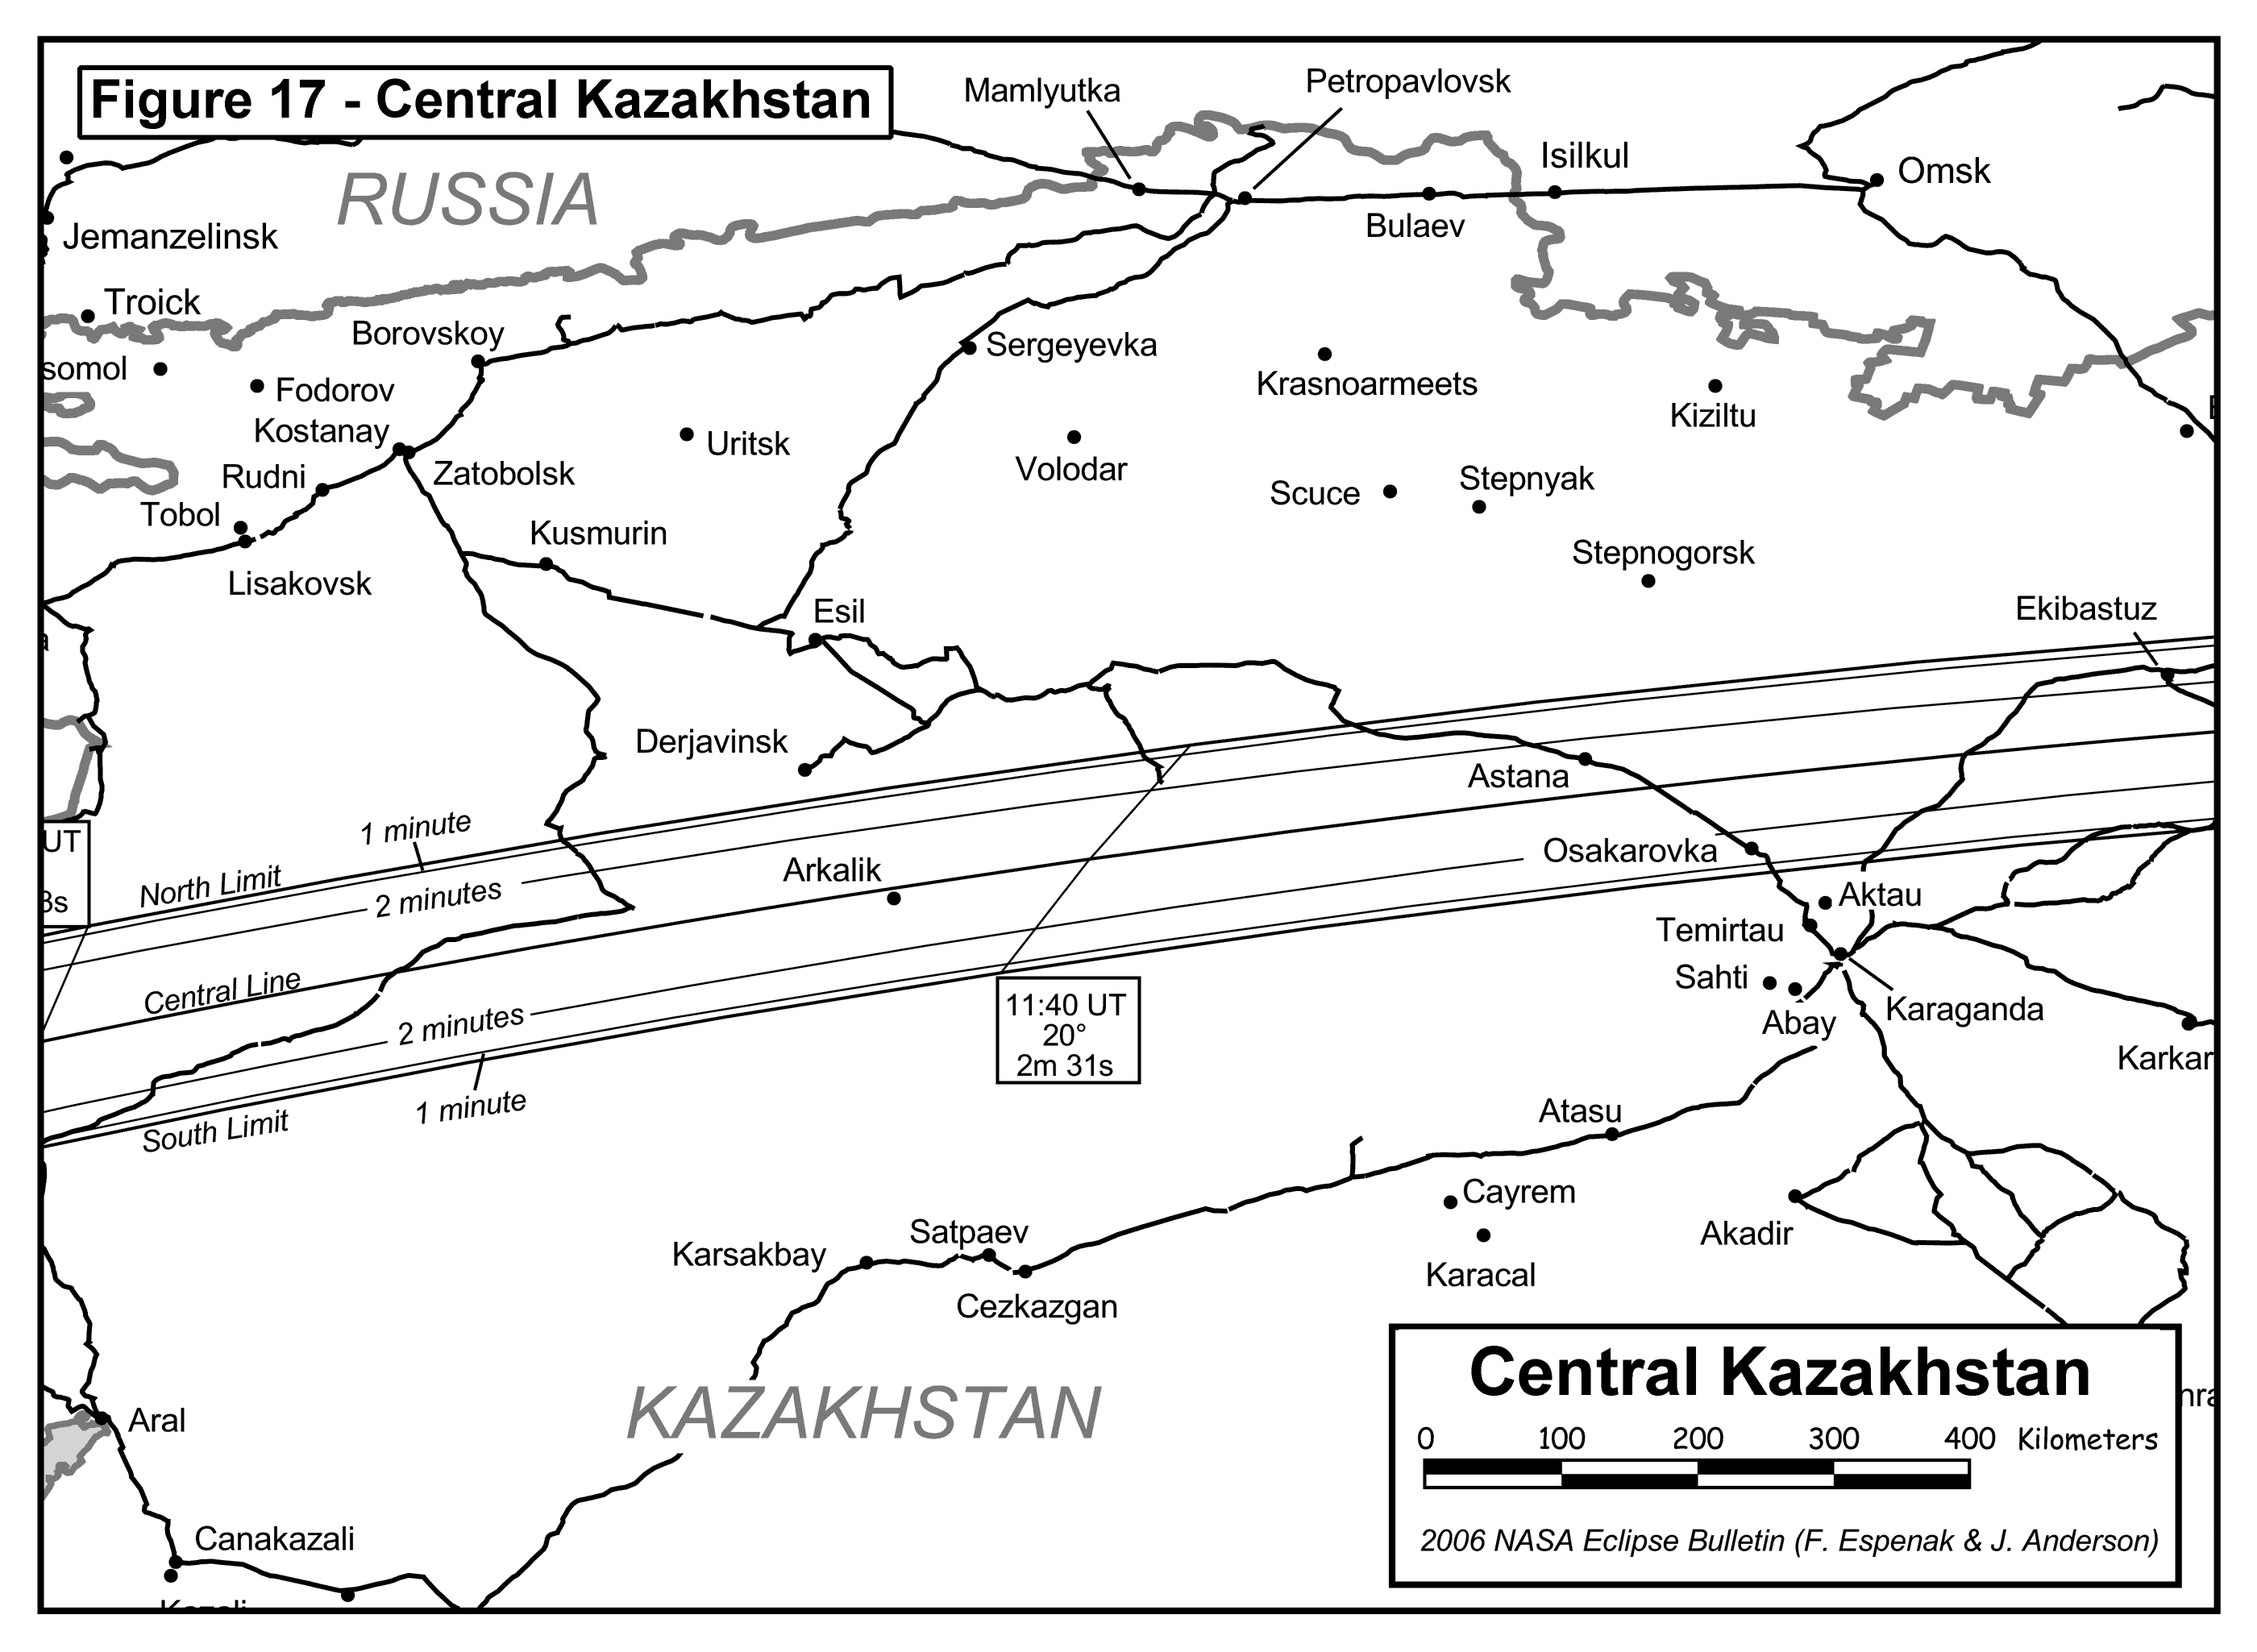
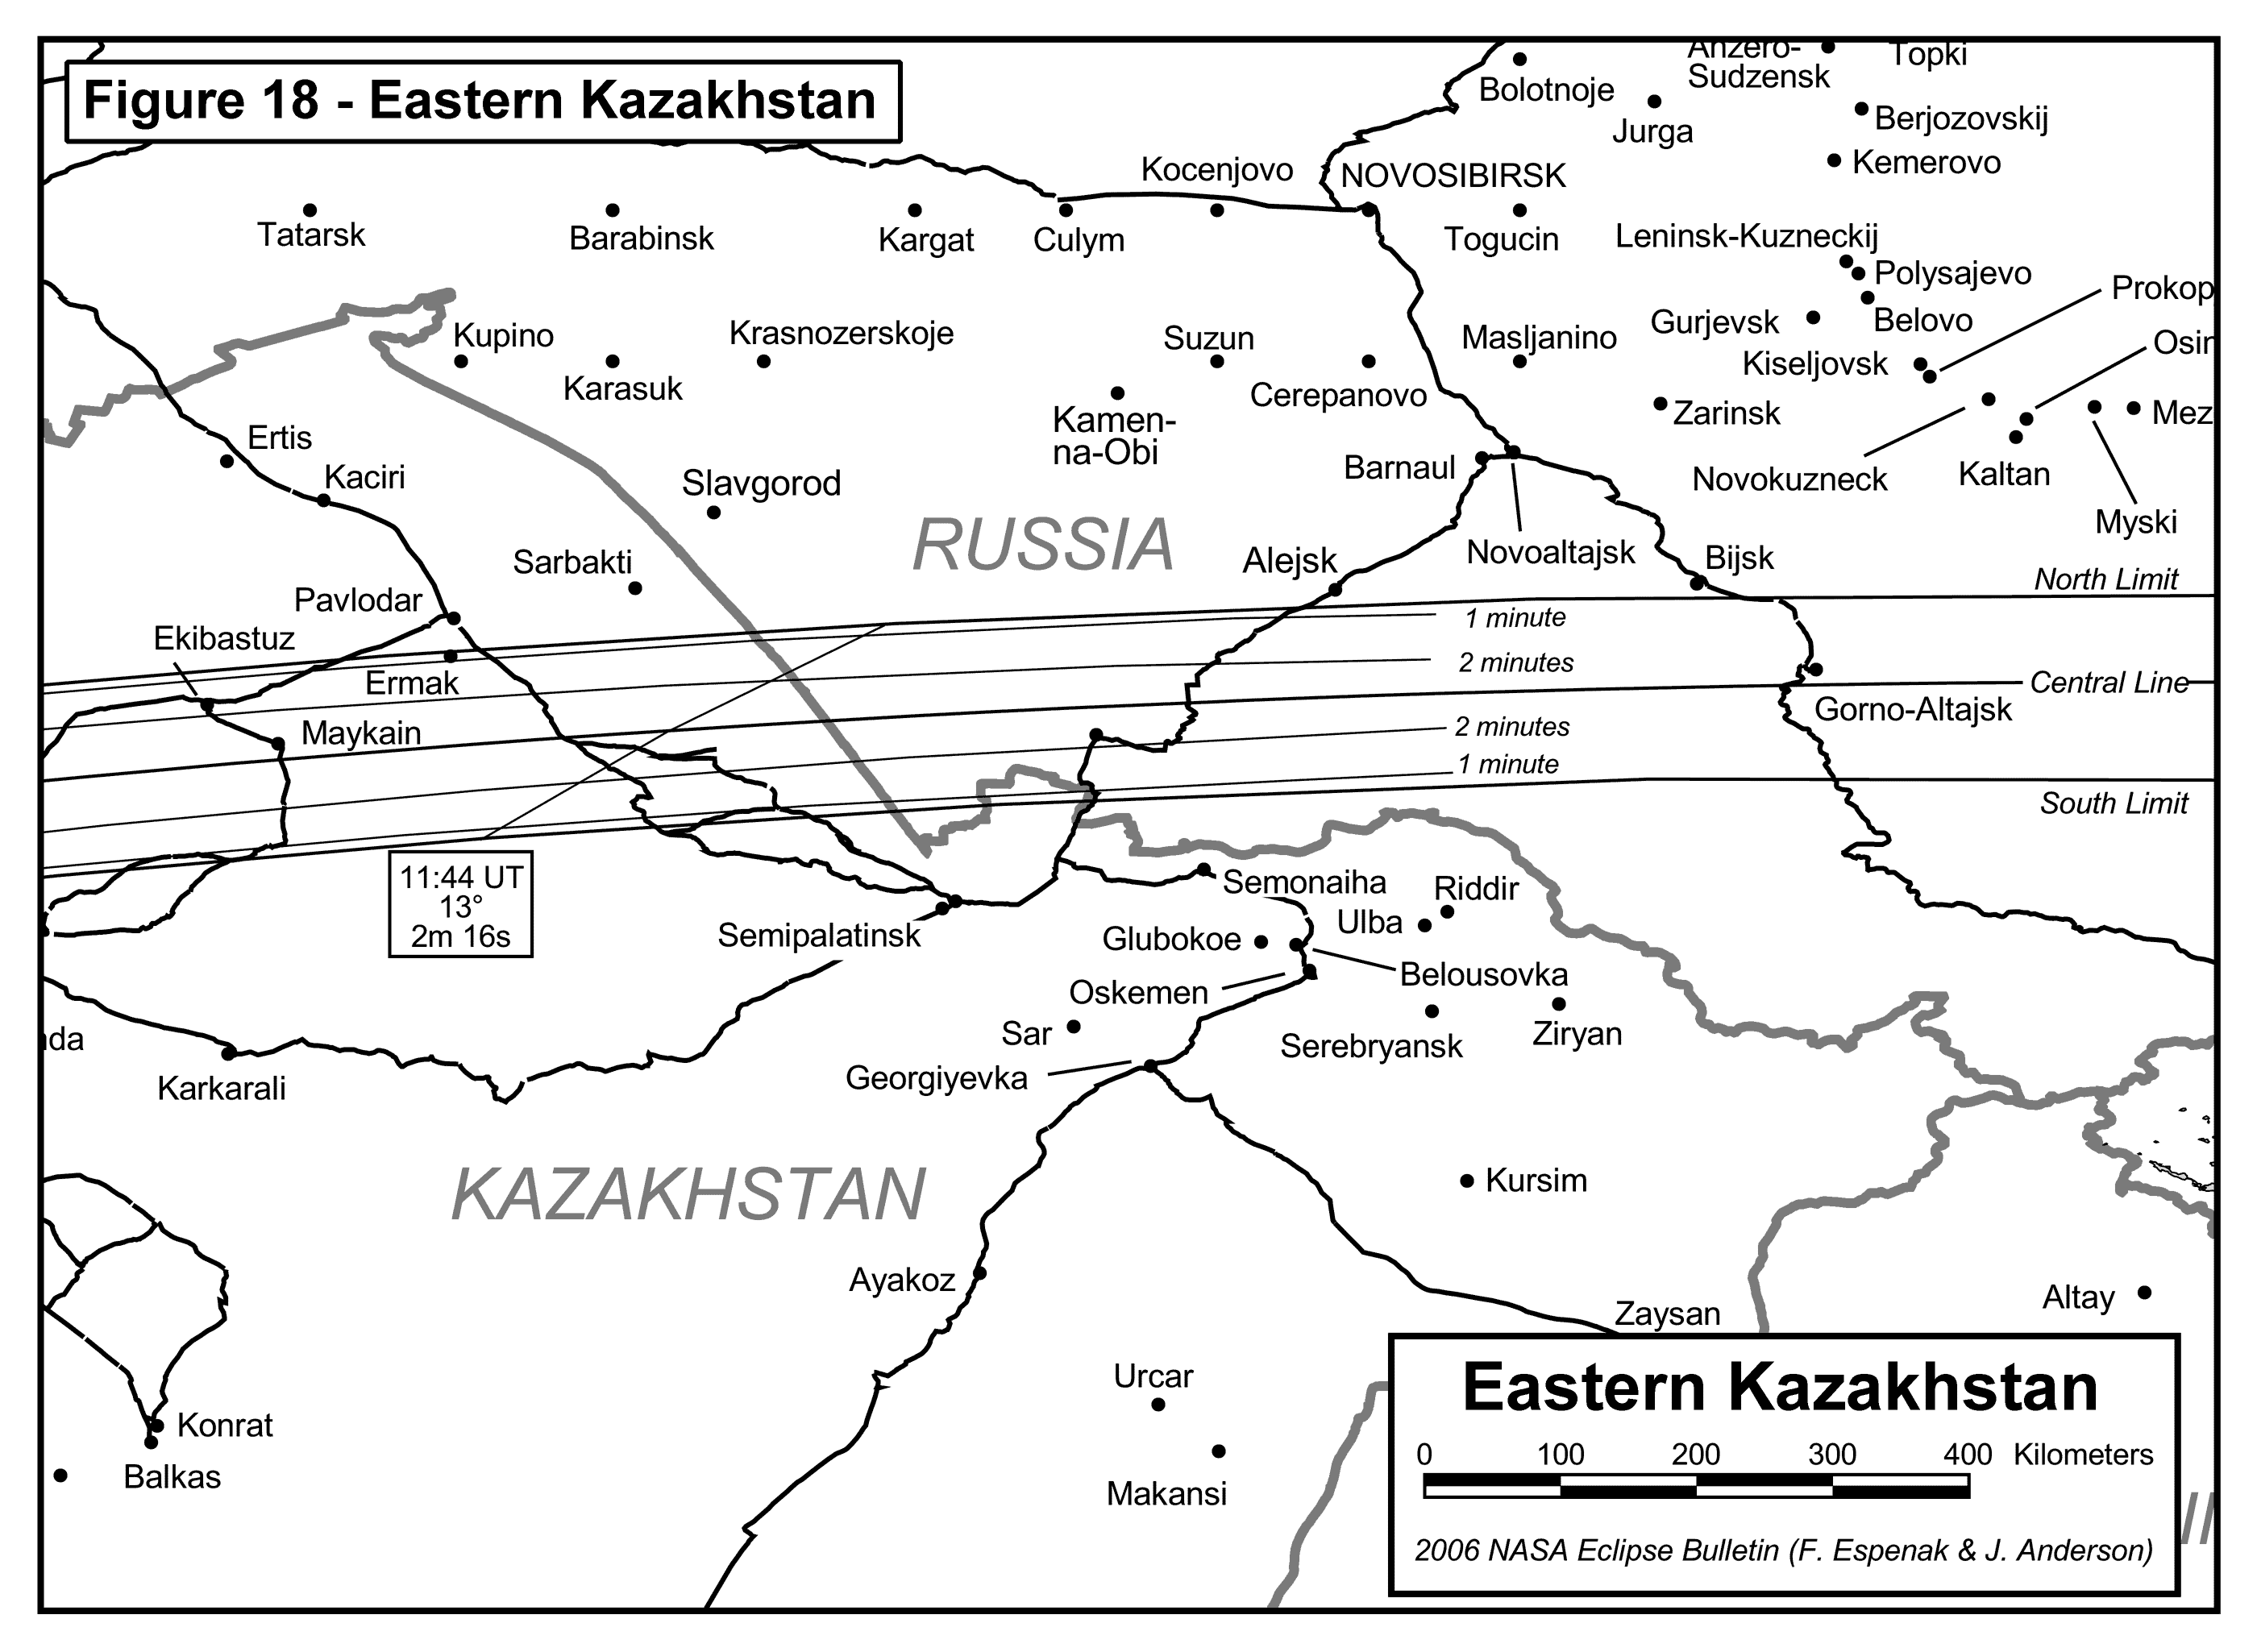
The following maps show path of the 2006 total eclipse in greater detail. They use high resolution coastline, city and highway data from the Digital Chart of the World (DCW). Each map was chosen to isolate a specific region along the land portion of the eclipse path. Curves of maximum eclipse are included as well as the outline of the umbral shadow. Within the umbral path, curves of constant duration have been plotted for totality.
Each map is available in two resolutions: 'Low' (web resolution) and 'High' (300 dpi print resolution). You may need to set your printer to 25% reduction in order to print 'High' resolution figures on a single page.
| Figure Number |
Title/Description | Low Resolution |
High Resolution |
| Figure 7 | Ghana and Togo | Low | High |
| Figure 8 | Benin and Nigeria | Low | High |
| Figure 9 | Nigeria and Niger | Low | High |
| Figure 10 | Niger | Low | High |
| Figure 11 | Niger, Chad and Libya | Low | High |
| Figure 12 | Libya and Egypt | Low | High |
| Figure 13 | Southern Turkey | Low | High |
| Figure 14 | Northern Turkey | Low | High |
| Figure 15 | Georgia and the Caucasus | Low | High |
| Figure 16 | Kazakhstan - Caspian Sea | Low | High |
| Figure 17 | Central Kazakhstan | Low | High |
| Figure 18 | Eastern Kazakhstan | Low | High |
| Figure 19 | Russia and Mongolia | Low | High |
Adapted from NASA Tech. Pub. "Total Solar Eclipse of 2006 March 29" (NASA/TP-2004-212762).
Interactive Map of the Path of Totality
An implementation of Google Map has been created which includes the central path of the 2006 total solar eclipse. This allows the user to sellect any portion of the path and to zoom in using either map data or Earth satellite data.
Eclipse Elements, Shadow Contacts and Path of Totality
The following tables give detailed predictions including the Besselian Elements, shadow contacts with Earth, path of the umbral shadow and topocentric data (with path corrections) along the path. Also included are special extended version tables of path coordinates and graze zones in formats convenient for plotting on maps.
- Table 1 - Elements of the Eclipse
- Table 2 - Shadow Contacts and Circumstances
- Table 3 - Path of the Umbral Shadow
- Table 4 - Physical Ephemeris of the Umbral Shadow
- Table 5 - Local Circumstances on the Central Line
- Table 6 - Topocentric Data and Path Corrections Due to Lunar Limb Profile
- Table 7 - Mapping Coordinates for the Umbral Path
- Table 7x - Mapping Coordinates for the Umbral Path (Extended - 7.5´ step size)
- Table 8 - Mapping Coordinates for the Zones of Grazing Eclipse
- Table 8x - Mapping Coordinates for the Zones of Grazing Eclipse (Extended - 7.5´ step size)
Local Circumstances
The following tables give the local circumstances of the eclipse from various cities throughout Europe, Africa and Asia. These tables have a lot of columns and, consequently, are quite wide. To print them, set the paper orientation of your printer to "landscape" and set the scale to about 60%. All contact times are given in the tables are in Universal Time.
- Table 09 - Local Circumstances for Brasil and Atlantic Ocean
- Table 10 - Local Circumstances for Africa
- Table 13 - Local Circumstances for Europe
- Table 16 - Local Circumstances for Near East
- Table 17 - Local Circumstances for Georgia and Turkey
- Table 18 - Local Circumstances for Russia
- Table 19 - Local Circumstances for Asia
Additional Tables
- Table 20 - Solar Eclipses of Saros Series 139
- Table 21 - Weather Statistics for March along the Eclipse Path
- Table 22 - 35 mm Field of View for Various Focal Lengths
- Table 23 - Solar Eclipse Exposure Guide
Additional Figures
| Figure Number |
Title/Description | Low Resolution |
High Resolution |
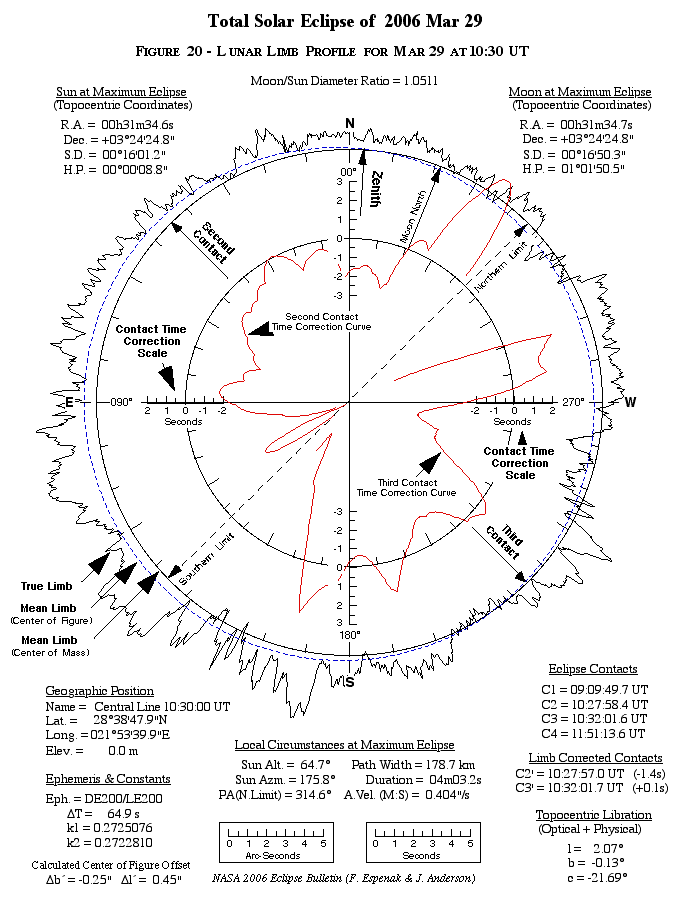
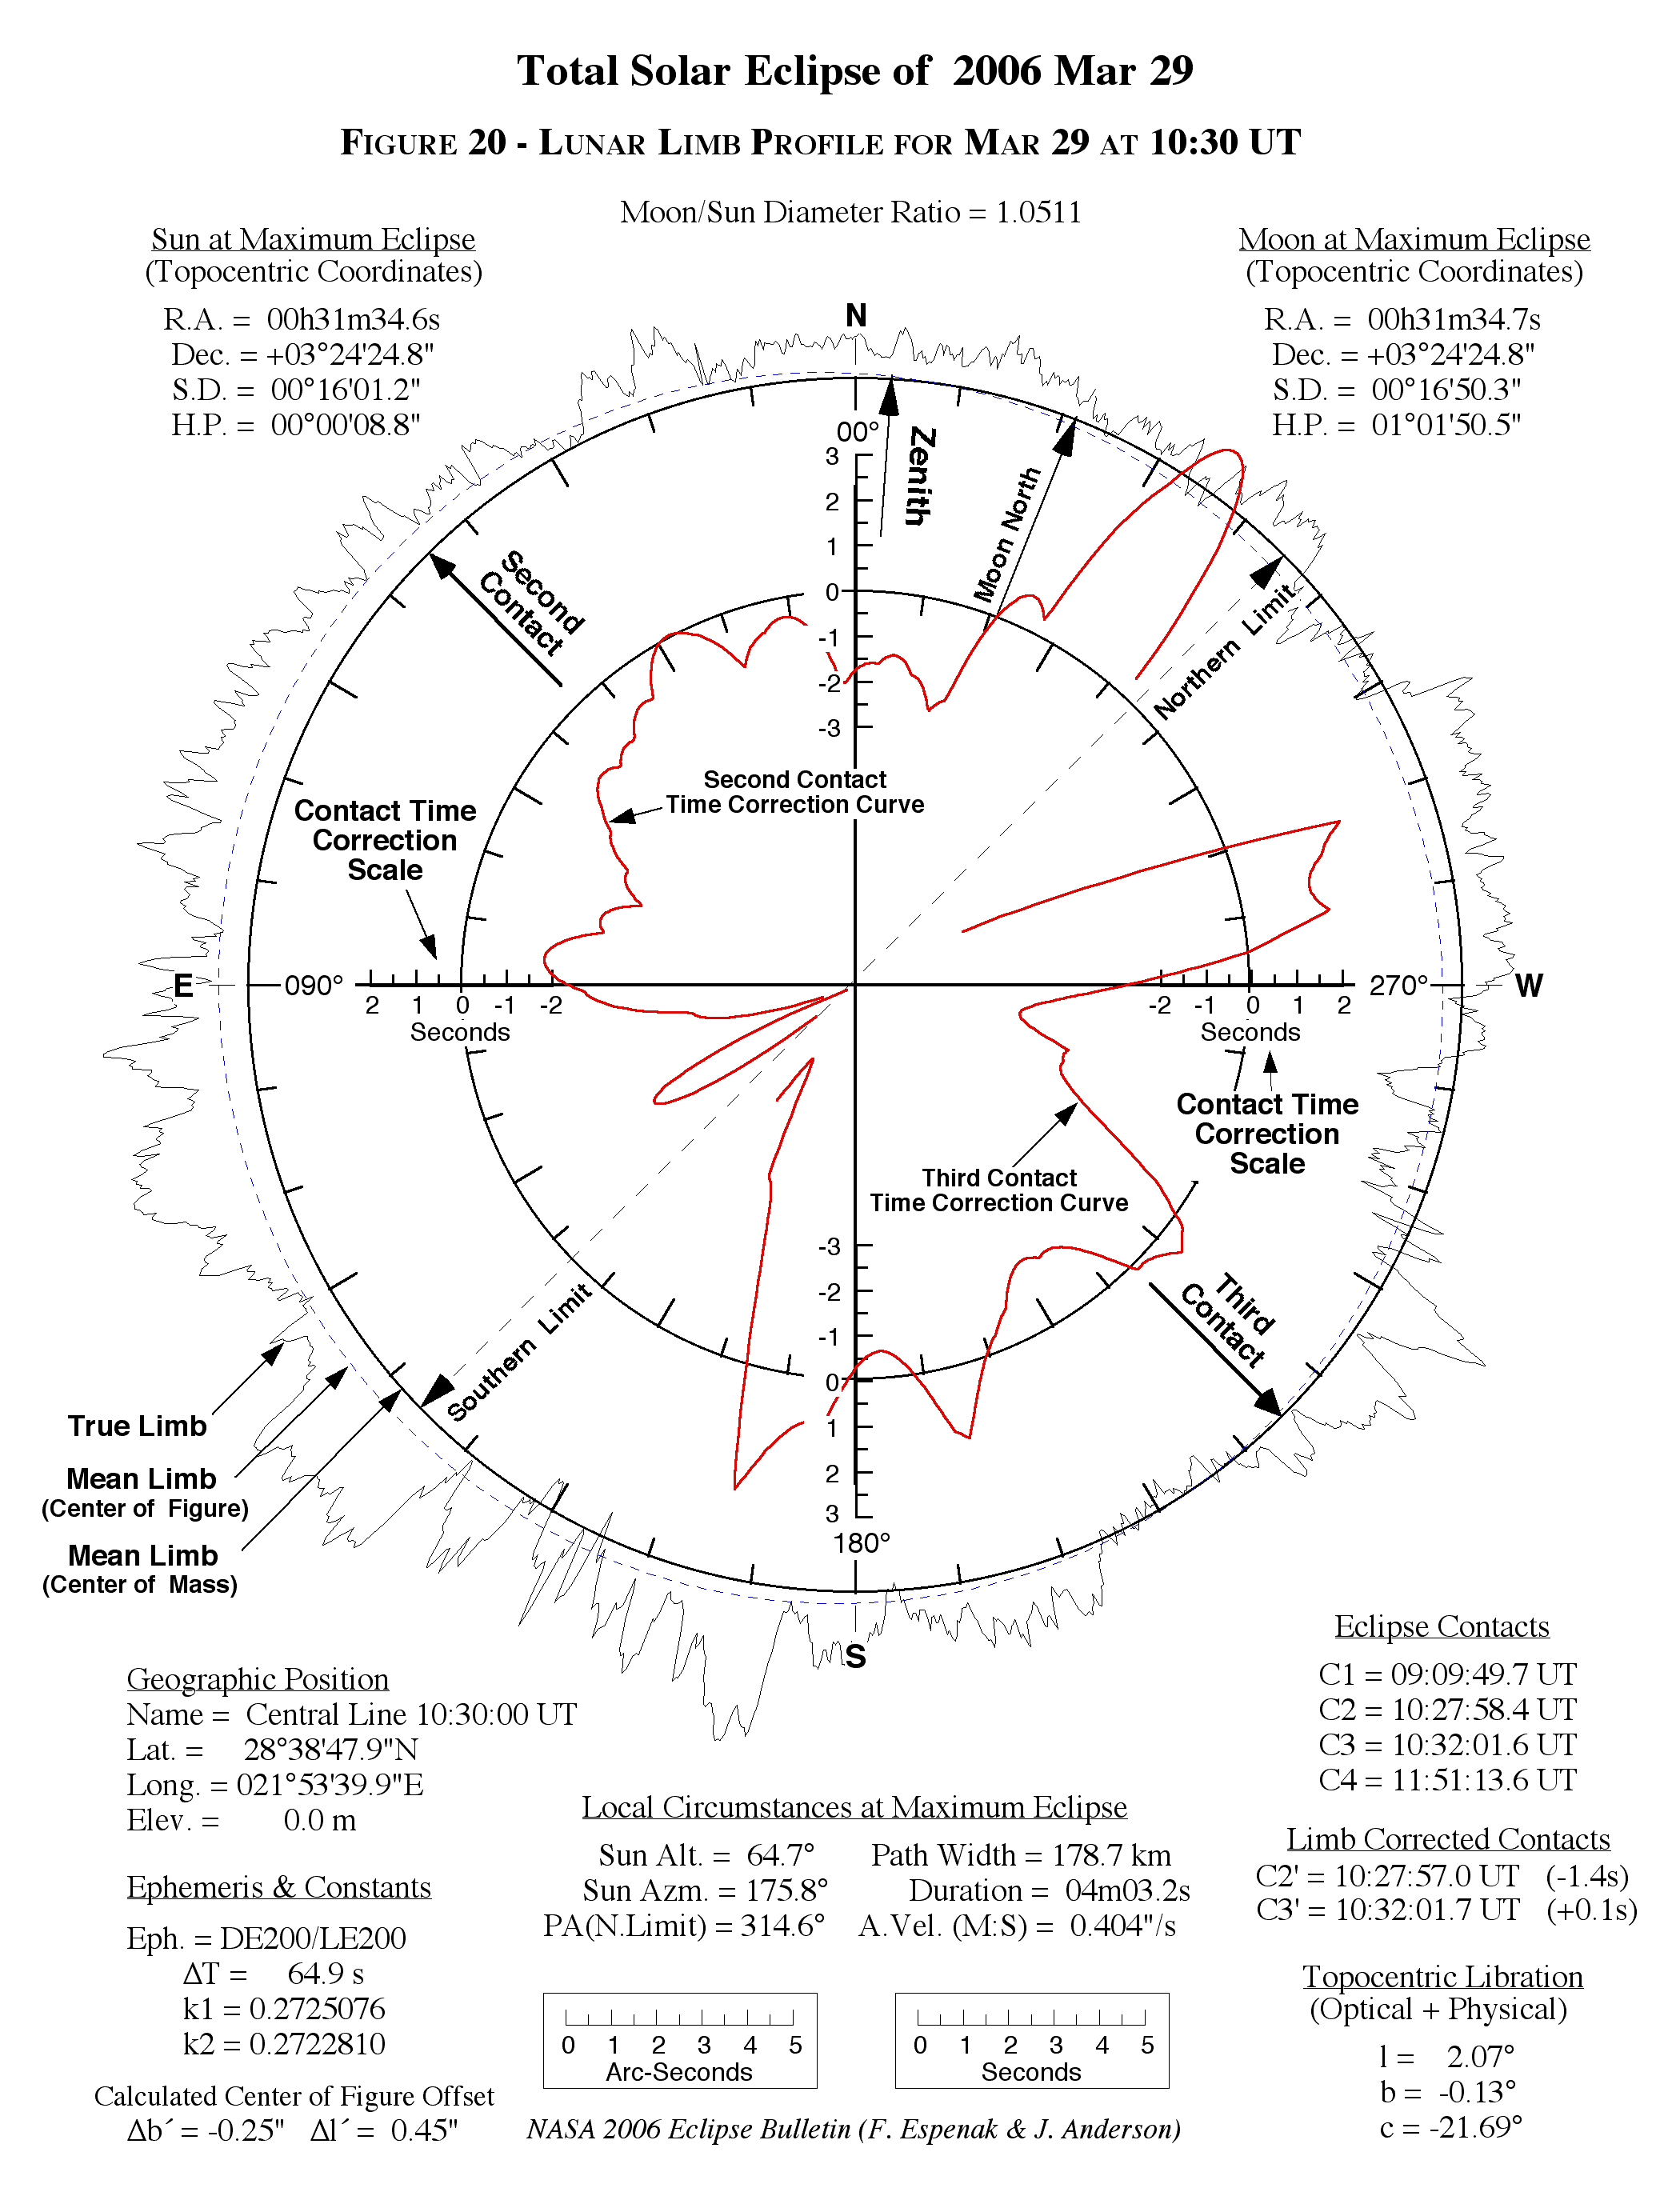
| Figure 20 | Lunar Limb Profile for March 29 at 10:30 UT | Low | High |
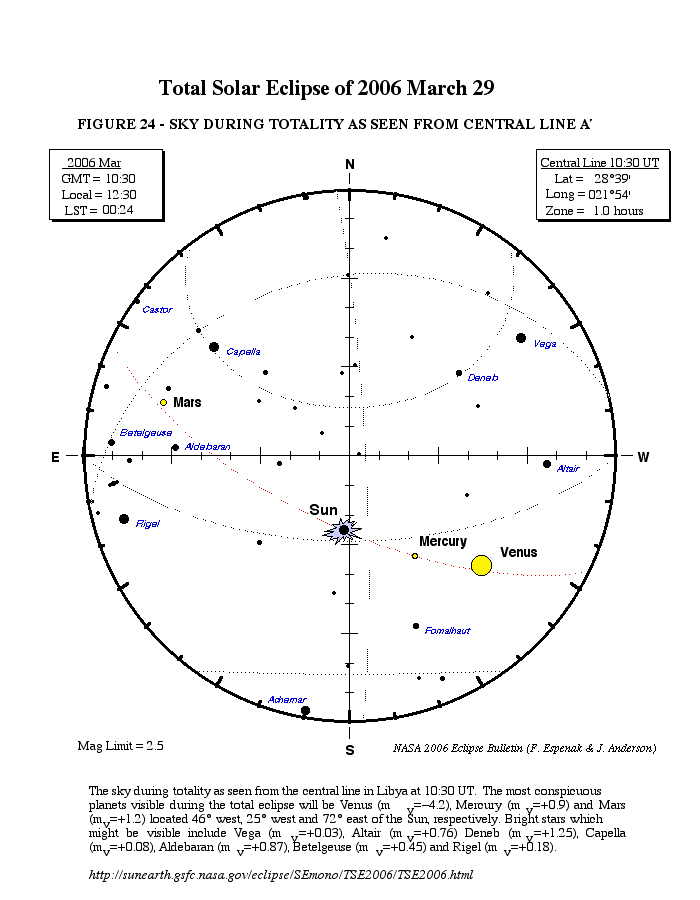
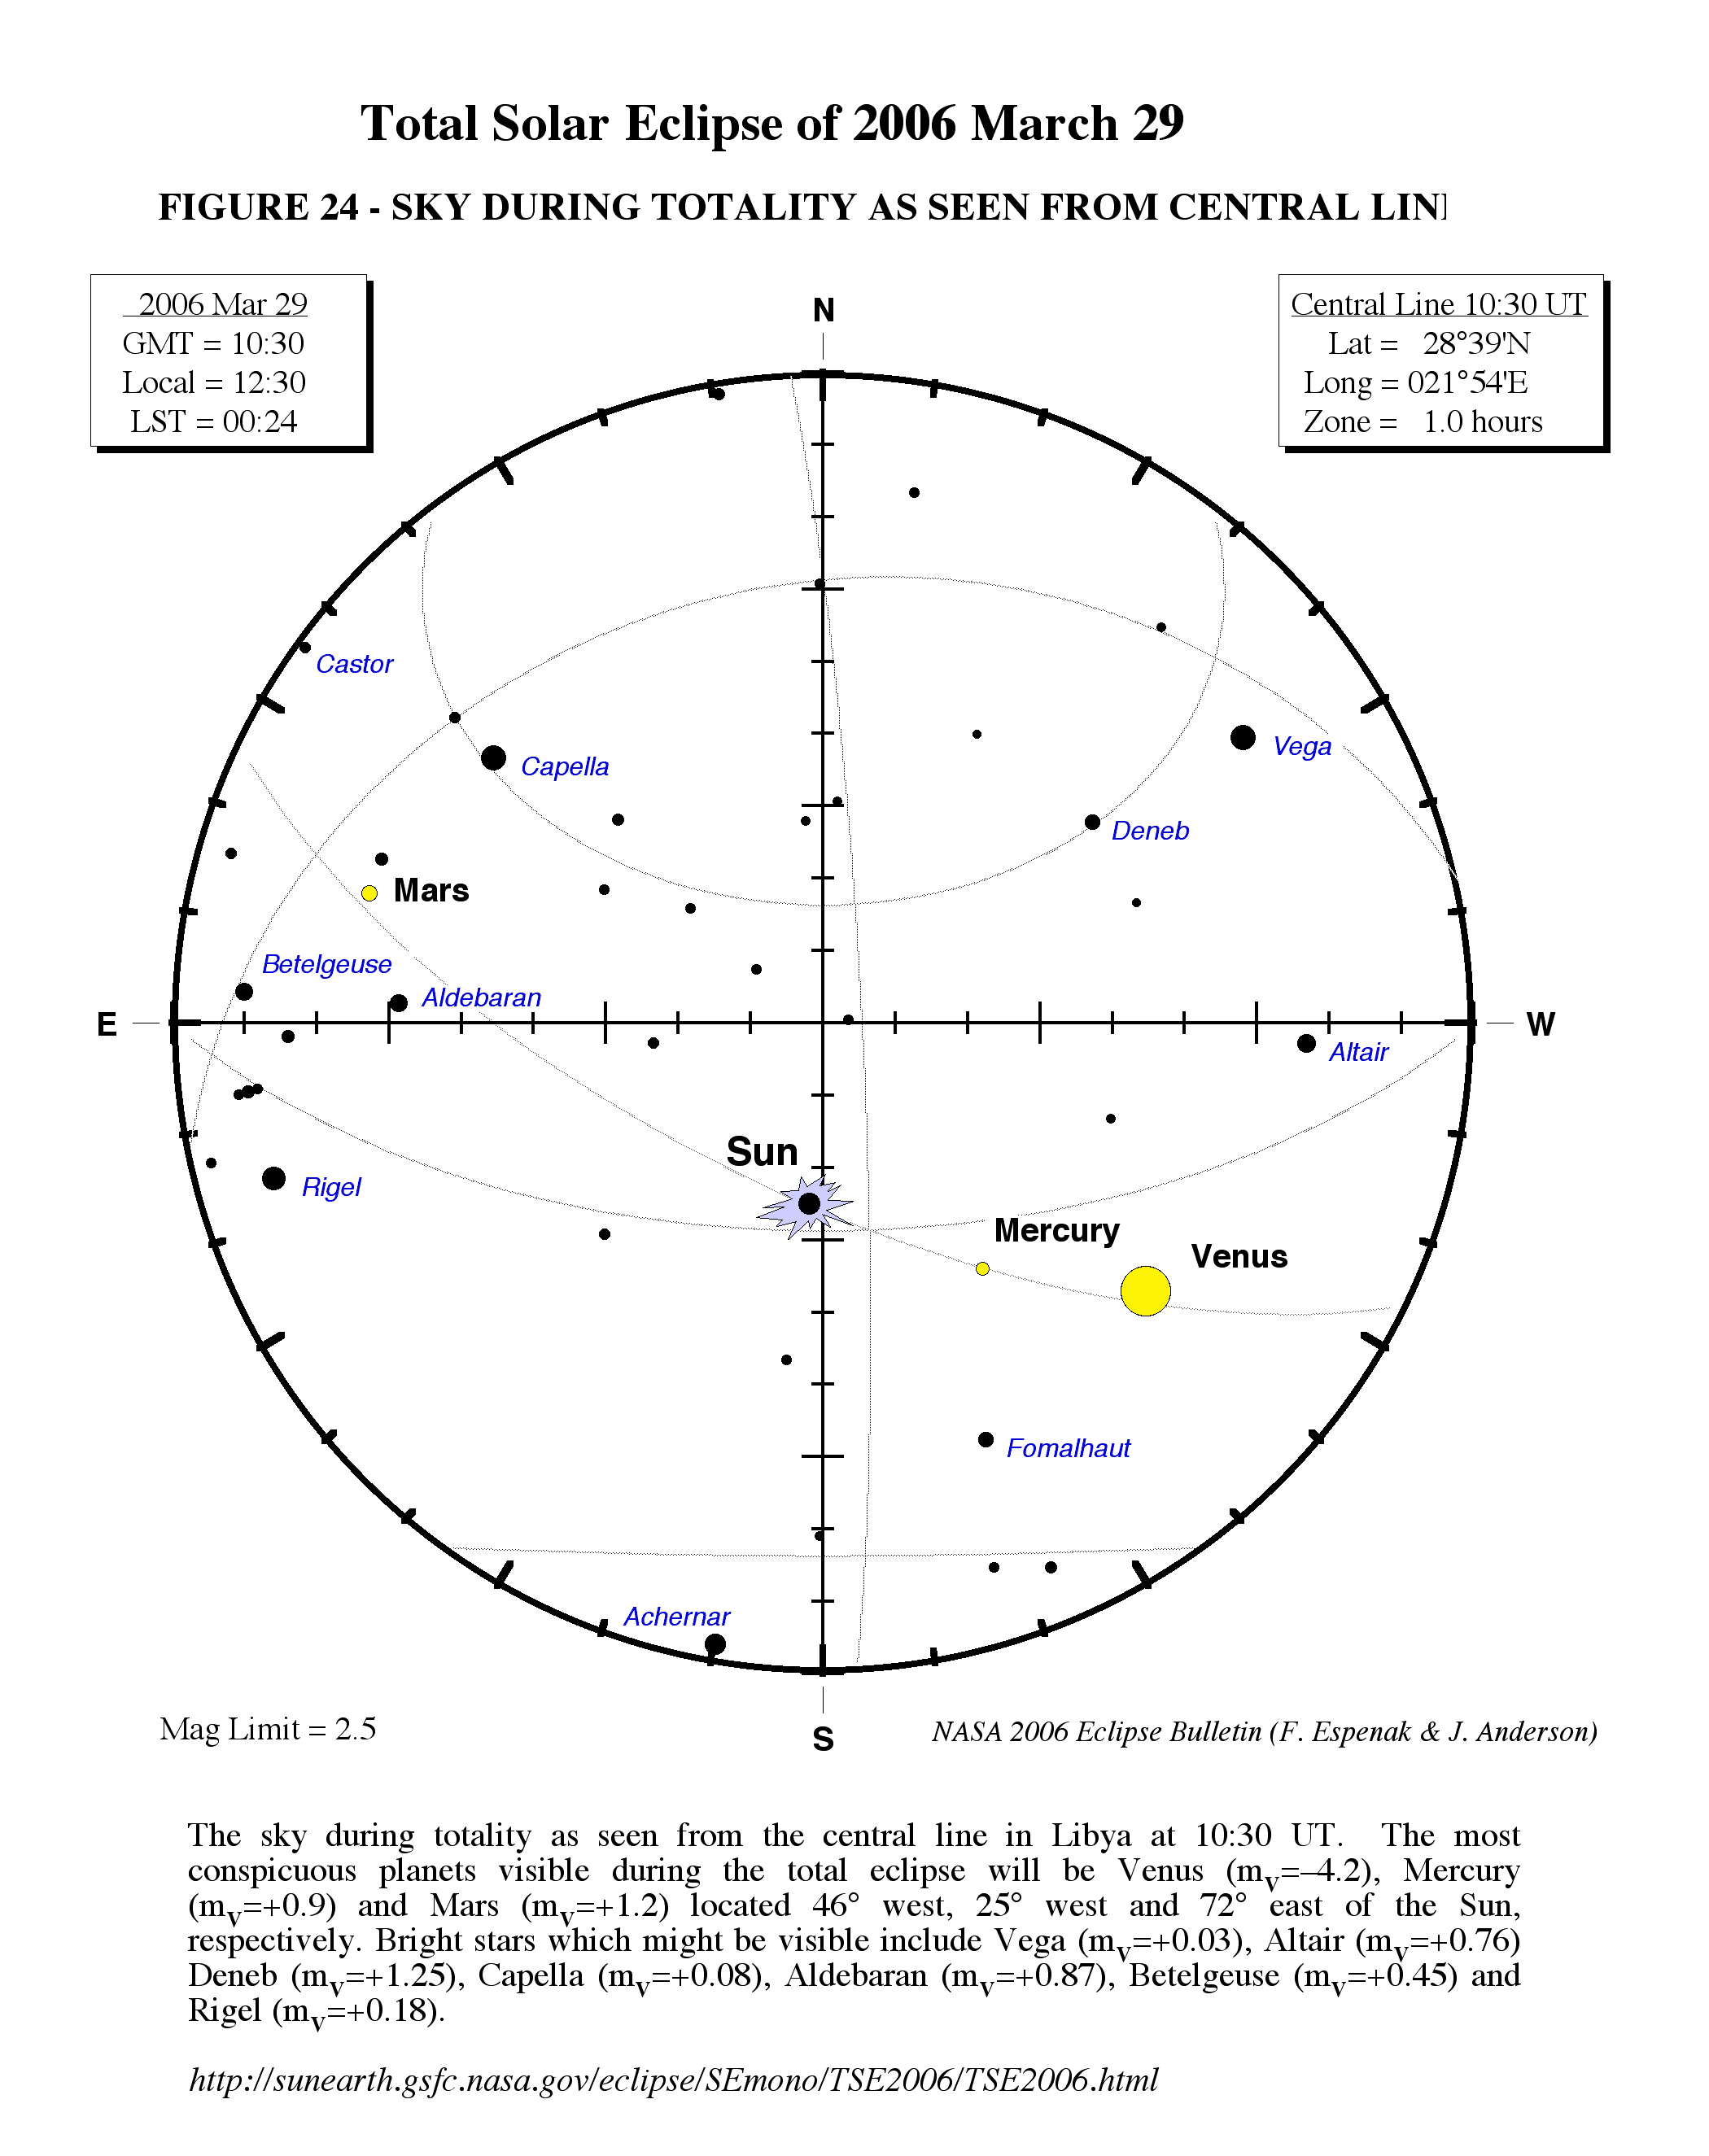
| Figure 24 | Sky During Totality: Central Line at 10:30 UT | Low | High |
Adapted from NASA Tech. Pub. "Total Solar Eclipse of 2006 March 29" (NASA/TP-2004-212762).
Links to other Web Sites for the 2006 Total Eclipse
- NASA/TP-2004-212762: Total Solar Eclipse of 2006 March 29
- NASA Sun-Earth Day 2006 - Educational resources for students, educators, scientists and museums.
- Weather Prospects for 2006 Total Eclipse - Jay Anderson
- Predictions & Maps for 2006 Total Eclipse (www.astronomie.info)
- 2006 Total Eclipse Animation (GIF) - A.T. Sinclair
- Eclipses During 2006
- The Sky at Your Fingertips - Jorge Almeida (in Portuguese)
Live Web Coverage of the 2006 Total Eclipse
In February 2006, links will appear which will provide live web coverage of the eclipse (if any are available).
- Live Webcast (Side, TURKEY) - NASA Sun-Earth Connection.
- Live Webcast (Side, TURKEY) - Exploratorium.
- Live Webcast (TURKEY) - University of North Dakota, USA.
- Live Webcast (TURKEY) - www.live-eclipse.org, JAPAN.
- Live Webcast (???) - Saros Group Scientific Expeditions.
- Live Webcast (Ghana) - University of Cape Coast.
- High Moon Webcast (Sallum EGYPT) - Olivier Staiger.
- Live Webcast (Antalya, TURKEY) .
- Live Webcast (Tabatinga, BRASIL) by Manual Digital (in Portuguese).
Reproduction of Eclipse Data
All eclipse calculations are by Fred Espenak, and he assumes full responsibility for their accuracy. Permission is freely granted to reproduce this data when accompanied by an acknowledgment:
"Eclipse Predictions by Fred Espenak, NASA's GSFC"
For more information, see: NASA Copyright Information
