Total Solar Eclipse of 2009 July 22
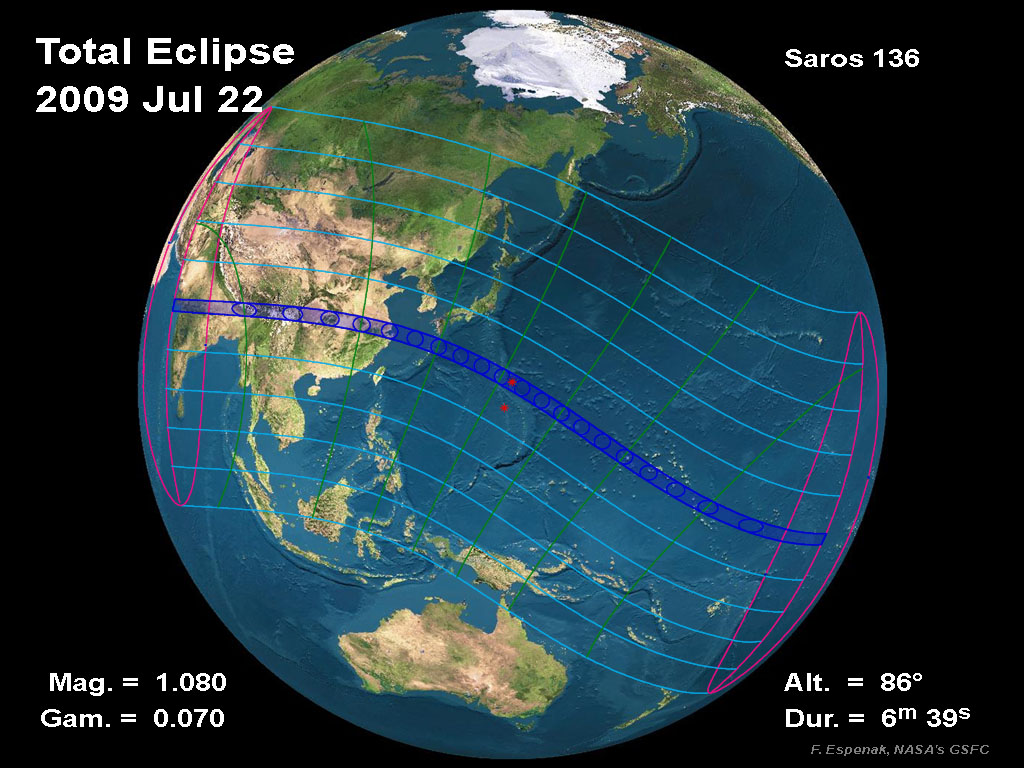
On Wednesday, 2009 July 22, a total eclipse of the Sun is visible from within a narrow corridor that traverses half of Earth. The path of the Moon's umbral shadow begins in India and crosses through Nepal, Bangladesh, Bhutan, Myanmar and China. After leaving mainland Asia, the path crosses Japan's Ryukyu Islands and curves southeast through the Pacific Ocean where the maximum duration of totality reaches 6 min 39 s. A partial eclipse is seen within the much broader path of the Moon's penumbral shadow, which includes most of eastern Asia, Indonesia, and the Pacific Ocean.
This web site has been established for the purpose of providing detailed predictions, maps, figures and information about this important event. The material here is adapted from the NASA Technical Publication "Total Solar Eclipse of 2009 July 22" (NASA/TP-2008-214169). The document will be published in 2008 March. It is part of NASA's official eclipse bulletin publication series. Instructions and a form for ordering a hard copy of this publication can be found at: Order Form for NASA Eclipse Bulletins.
Preliminary Look at the Total Solar Eclipse of 2009 Jul 22
- Figure 1 - Orthographic (Global) Projection of the 2009 Total Solar Eclipse
- Figure 2 - 2009 Eclipse Path Through India, Nepal, Bhutan, and Bangladesh
- Figure 3 - 2009 Eclipse Path Through China
- Figure 4 - 2009 Eclipse Path Through Southern Japan
- Figure 5 - 2009 Eclipse Path Through the Marshall and Gilbert Islands
- Figure 6 - Mean Cloudiness in July Along the 2009 Eclipse Path (from satellite imaging)
- Figure 7 - Climate Statistics for July Along the 2009 Eclipse Path
- Figure 8 - Average July Cloudiness Along the 2009 Eclipse Path
This data was presented at: IAU Symposium 233 - Solar Activity and Its Magnetic Origin
See also: Eclipse Weather and Maps (Jay Anderson)
Interactive Map of the Path of Totality
An implementation of Google Map has been created which includes the central path of the 2009 total solar eclipse. This allows the user to select any portion of the path and to zoom in using either map data or Earth satellite data.
General Maps of the Eclipse Path
The following maps show the overall regions of visibility of the partial eclipse as well as the path of the total eclipse through Asia and the Pacific Ocean. They use high resolution coastline data from the World Data Base II (WDB). Each map was chosen to isolate a specific region along the land portion of the eclipse path. Curves of maximum eclipse are included as well as the outline of the umbral shadow.
The maps are available as high resolution (300 dpi) PDF files.
| Figure Number | Title/Description | Map File |
| Figure 1 | Orthographic (Global) Map of 2009 Total Solar Eclipse | |
| Figure 2 | Map of 2009 Eclipse Path Through Asia | |
| Figure 3 | Map of 2009 Eclipse Path Through India and Bhutan | |
| Figure 4 | Map of 2009 Eclipse Path Through China | |
| Figure 5 | Map of 2009 Eclipse Path South of Japan |
From NASA Tech. Pub. "Total Solar Eclipse of 2009 July 22" (NASA/TP-2008-214169).
Detailed Maps of the Path of Totality
The following maps show path of the 2009 total eclipse in greater detail. They use high resolution coastline, city and highway data from the Digital Chart of the World (DCW). Each map was chosen to isolate a specific region along the land portion of the eclipse path. Curves of maximum eclipse are included as well as the outline of the umbral shadow. Within the umbral path, curves of constant duration have been plotted for totality.
The maps are available as high resolution (300 dpi) PDF files.
| Figure Number |
Title/Description | Map File |
| Figure 6 | India - Mumbai | |
| Figure 7 | India - Bhopal | |
| Figure 8 | India (Patna) - Nepal | |
| Figure 9 | India - Bhutan | |
| Figure 10 | India - Burma - China | |
| Figure 11 | China - Chengdu | |
| Figure 12 | China - Chongquig | |
| Figure 13 | China - Wuhan | |
| Figure 14 | China - Shanghai | |
| Figure 15 | Japan - Ryukyu Islands | |
| Figure 16 | Japan - Iwo Jima | |
| Figure 17 | Marshall Islands | |
| Figure 18 | Kiribati | |
| Figure 19 | Phoenix Islands |
From NASA Tech. Pub. "Total Solar Eclipse of 2009 July 22" (NASA/TP-2008-214169).
Additional Figures
The following figures also appear in the NASA/TP-2008-214169, "Total Solar Eclipse of 2009 July 22".
| Figure Number |
Title/Description | Figure File |
| Figure 20 | Lunar Limb Profile for July 22 at 01:30 UT | |
| Figure 21 | Average July Cloud Amount Along the Central Line | |
| Figure 22 | Number of Typhoons from 1955 to 2007 | |
| Figure 23 | Spectral Response of Common Solar Filters | |
| Figure 24 | Focal Length Vs. Image Size for Eclipse Photography | |
| Figure 25 | Sky During Totality from Central Line at 01:30 UT |
From NASA Tech. Pub. "Total Solar Eclipse of 2009 July 22" (NASA/TP-2008-214169).
Supplementary Figures
The following figures do not appear in the NASA 2009 Eclipse Bulletin due to page constraints. They are presented here as supplementary material for the bulletin.
| Figure Number |
Title/Description | Figure File |
| Figure 20b | Lunar Limb Profile for July 22 at 00:55 UT | |
| Figure 20c | Lunar Limb Profile for July 22 at 02:00 UT | |
| Figure 20d | Lunar Limb Profile for July 22 at 03:45 UT | |
| Figure 20e | Lunar Limb Profile for July 22 at 04:15 UT | |
| Figure 25b | Sky During Totality from Central India at 00:55 UT | |
| Figure 25c | Sky During Totality from South of Japan at 02:00 UT | |
| Figure 25d | Sky During Totality from Marshall Islands at 03:45 UT | |
| Figure 25e | Sky During Totality from Phoenix Islands at 04:15 UT |
Eclipse Elements, Shadow Contacts and Path of Totality
The following tables give detailed predictions including the Besselian Elements, shadow contacts with Earth, path of the umbral shadow and topocentric data (with path corrections) along the path. Also included are special extended version tables of path coordinates and graze zones in formats convenient for plotting on maps.
- Table 1 - Elements of the Eclipse
- Table 2 - Shadow Contacts and Circumstances
- Table 3 - Path of the Umbral Shadow
- Table 4 - Physical Ephemeris of the Umbral Shadow
- Table 5 - Local Circumstances on the Central Line
- Table 6 - Topocentric Data and Path Corrections Due to Lunar Limb Profile
- Table 7a - Mapping Coordinates for the Umbral Path
- Table 7b - Mapping Coordinates for the Umbral Path (Extended - 7.5´ step size)
- Table 8a - Mapping Coordinates for the Zones of Grazing Eclipse
- Table 8b - Mapping Coordinates for the Zones of Grazing Eclipse (Extended - 7.5´ step size)
From NASA Tech. Pub. "Total Solar Eclipse of 2009 July 22" (NASA/TP-2008-214169).
Local Circumstances
The following tables give the local circumstances of the eclipse from various cities throughout Asia and the Pacific Ocean. All contact times are given in the tables are in Universal Time.
- Tables 09 - Local Circumstances for India
- Table 10 - Local Circumstances for China - 1
- Table 11 - Local Circumstances for China - 2
- Table 12 - Local Circumstances for Asia
- Table 13 - Local Circumstances for Southeast Asia
- Table 14 - Local Circumstances for Japan and Pacific
From NASA Tech. Pub. "Total Solar Eclipse of 2009 July 22" (NASA/TP-2008-214169).
Additional Tables
The following tables also appear in the NASA/TP-2008-214169, "Total Solar Eclipse of 2009 July 22".
- Table 15 - Solar Eclipses of Saros Series 136
- Table 16 - Climate Statistics Along the 2009 Eclipse Path
- Table 17 - Cloud and Sunshine Statistics Along the 2009 Eclipse Path
- Tables 18 & 19 - Eclipse Photography
Explanation of Eclipse Maps and Tables
The following links give detailed descriptions and explanations of the eclipse maps and tables.
- Map 1 - Orthographic Map of the Eclipse Path
- Table 1 - Elements of the Eclipse
- Table 2 - Shadow Contacts and Circumstances
- Table 3 - Path of the Umbral (or Antumbral) Shadow
- Table 4 - Physical Ephemeris of the Umbral (or Antumbral) Shadow
- Table 5 - Local Circumstances on the Central Line
- Table 6 - Topocentric Data and Path Corrections Due to Lunar Limb Profile
- Table 7 - Mapping Coordinates for the Central Path
- Table 8 - Coordinates for the Zones of Grazing Eclipse
- Mean Lunar Radius
- Lunar Limb Profile
- Limb Corrections to the Path Limits: Graze Zones
- Local Circumstances Tables for Total Solar Eclipses
Live Web Coverage of the 2009 Total Solar Eclipse
The following links will provide live web coverage of the 2009 eclipse.
- Live Webcast (CHINA) - U. of North Dakota.
- LIVE! UNIVERSE, Japan Webcast (JAPAN)
- Taiwan Webcast Group Webcast (Mainland CHINA)
Reproduction of Eclipse Data
All eclipse calculations are by Fred Espenak, and he assumes full responsibility for their accuracy. Permission is freely granted to reproduce this data when accompanied by an acknowledgment:
"Eclipse Predictions by Fred Espenak, NASA's GSFC"
For more information, see: NASA Copyright Information
